
Three months into production, I opened my OpenAI dashboard. $550 for the month. Not terrible, but we were only handling 200K requests. Our product manager had just shown me the growth projections: 2M requests by Q2, 5M by Q3.
Quick math: at $0.00275 per request (gpt-4o), that’s $5.5K/month by Q2, scaling to $13.75K/month by Q3. $165K annually on API calls alone.
My manager asked: “Can we run this ourselves?”
My first thought: “Self-hosting sounds expensive and complicated.”
Turns out I was wrong about the expensive part. At our scale, self-hosting would cost about $700/month. That’s over $156K in annual savings at our projected scale.
When Self-Hosting Makes Sense (And When It Doesn’t)
Let’s do the math first.
The Cost Breakdown
OpenAI API costs (GPT-4o):
Assuming ~700 input tokens + 100 output tokens per request.
Cost per request calculation:
- Input 700 tokens × $0.0025/1K = $0.00175
- Output: 100 tokens × $0.010/1K = $0.001
- Total: ~$0.00275 per request
- Cost per request: ~$0.00275
- 100K requests/month: $275
- 500K requests/month: $1,375
- 1M requests/month: $2,750
- 5M requests/month: $13,750
Self-hosted vLLM costs (1-Year Reserved Instance):
Assuming 24/7 usage.
- AWS g5.xlarge (1-Year RI): $0.634/hour × 720 hours = $456.48/month
- storage: $50/month
- Network transfer: $20/month
- Infrastructure Total: ~$527/month
Add maybe $200/month for engineering time (monitoring, maintenance). You’re looking at $727/month total.
Break-even point is ~264K requests/month.
Below that? Stick with the API. Above that? Self-hosting saves you money.
When to Self-Host
High Request Volume
With self-hosting, the costs don’t scale linearly like API costs do. With OpenAI, if you double your requests, you double your bill. But with self-hosting, your infrastructure costs stay roughly the same whether you’re processing 300K requests or 3M requests per month (until you need to scale horizontally).
Let’s walk through what this actually looks like at different volumes.
At 500K requests/month
OpenAI API Cost
- 500,000 requests × $0.00275 per request = $1,375/month
- Annual cost: $1,375 × 12 = $16,500/year
Self-Hosted Cost
- Infrastructure: $527/month (this stays constant)
- Engineering time: $200/month (this stays constant)
- Total: $727/month
- Annual cost: $727 × 12 = $8,724/year
Annual savings: $16,500 – $8,724 = $7,776/year
Not bad, but is it worth the operational complexity? Maybe, maybe not.
At 2M requests/month (projected Q2 volume)
OpenAI API Cost
- 2,000,000 requests × $0.00275 per request = $5,500/month
- Annual cost: $5,500 × 12 = $66,000/year
Self-Hosted Cost
- Infrastructure: $527/month (still the same!)
- Engineering time: $200/month (still the same!)
- Total: $727/month
- Annual cost: $727 × 12 = $8,724/year
Annual savings: $66,000 – $8,724 = $57,276/year
Now we’re talking. That’s a junior engineer’s salary you’re saving!
At 5M requests/month (projected Q3 volume)
OpenAI API Cost
- 5,000,000 requests × $0.00275 per request = $13,750/month
- Annual cost: $13,750 × 12 = $165,000/year
Self-Hosted Cost
- Infrastructure: $527/month (yep, still the same)
- Engineering time: $200/month (still the same)
- Total: $727/month
- Annual cost: $727 × 12 = $8,724/year
Annual savings: $165,000 – $8,724 = $156,276/year
That’s not a typo. You’re saving $156K per year at that scale.
Why Does this Matter?
Notice how our self-hosted costs stayed at $727/month across all three scenarios. That’s important! A single g5.xlarge instance can handle way more than 5M requests per month (with proper batching and optimization). Your costs are fixed until you need to scale horizontally.
Meanwhile, OpenAI’s costs scale perfectly with your usage. Great when you’re small, painful when you’re big.
This is why I say self-hosting becomes economical around 500K+ requests monthly. Below that, the savings aren’t dramatic enough to justify the operational overhead. Above that, the savings accelerate fast.
At our current trajectory (200K requests now, 5M by Q3), we’d be leaving $156K on the table by staying with the API. That pays for a lot of engineering time.
Rule of thumb: If your monthly request volume varies by more than 50%, you’ll want to either use on-demand instances (which costs more but scales with usage) or calculate your average monthly volume across the year.
Data Privacy Requirements and Custom Models
Let’s say you work at a healthcare company building an AI assistant that helps doctors write patient notes. Your training data includes thousands of real patient records with medical jargon, treatment patterns, and clinical language specific to your hospital system.
Unfortunately, you can’t upload that data to OpenAI’s servers to fine-tune GPT-4. Why? Because it’s protected health information under HIPAA. Sending patient data to a third party (even encrypted) violates compliance requirements. Your legal team would have a meltdown.
So what do you do? You need to fine-tune a model on your proprietary data, but that data legally cannot leave your infrastructure. The only solution is to download an open source model (like Llama-2 or Mistral), fine-tune it on your own servers with your own data, and run it entirely within your infrastructure. Self-hosting isn’t optional here. It’s the only way to do this legally.
Scenarios Where This Matters
Healthcare: You need a model that understands your hospital’s specific terminology, drug protocols, and documentation style. Training data includes patient records that must stay within your HIPAA-compliant infrastructure.
Financial Services: You’re building a model to detect fraudulent transactions based on your bank’s historical transaction patterns. That data includes customer financial information that can’t be sent to external APIs under PCI DSS regulations.
Legal Firms: You want a model trained on your firm’s past case documents, legal strategies, and client communications. Attorney-client privilege means this data absolutely cannot leave your servers.
Manufacturing: You’re creating a model to predict equipment failures based on proprietary sensor data from your factory floor. Your competitors would love to see that data. It’s a trade secret that stays internal.
Specialized Models Not Available via API: Sometimes the model you need just doesn’t exist as an API. In these cases, you’ll often find an open source base model and fine-tune it yourself. But once you’ve done that work, there’s no API to call. The model only exists on your infrastructure. You have to self-host it.
Latency-Sensitive Applications
When you call the OpenAI API, your request travels across the internet to OpenAI’s servers, waits in the queue, gets processed, and then the response travels back to you. The entire journey (what we call the “roundtrip”) takes 1-2 seconds on average.
With local inference using vLLM, your request stays inside your own infrastructure. No network hops, no external queues. The model responds in 200-500ms (that’s 0.2 to 0.5 seconds).
That might not sound like a huge difference, but think about typing in a chatbot. If every response takes 2 seconds, the conversation feels sluggish. Users notice. They get impatient. They leave.
But when responses come back in 300ms? The conversation flows naturally. It feels responsive. Users stay engaged.
This matters most for:
- Real-time chat applications where users expect instant responses
- Code autocomplete (imagine waiting 2 seconds every time you hit tab)
- Interactive demos or customer support bots
- Any feature where latency directly impacts user experience
If you’re building a batch processing system that analyzes resumes overnight, that extra 1-2 seconds per request doesn’t matter. But if you’re building a feature where users are actively waiting for responses? Every millisecond counts.
Latency test: Before committing to self-hosting for latency reasons, measure your current p95 and p99 latencies. Then ask: what would a 3-5x improvement actually change for your users? If the answer is “not much,” stick with the API.
When NOT to Self-Host
Low Volume
At 200K requests/month, you’re spending $550/month with the OpenAI API. Self-hosting costs $727/month. You’d be losing $177/month by self-hosting.
The break-even point is around 264K requests/month. Below that, the API is literally cheaper.
No Upfront Investment:
With an API, you create an account, get an API key, and start making requests in under 10 minutes.
With self-hosting, you need to provision a GPU instance, download models, write Docker configs, set up monitoring. That’s days of engineering work before your first request. And you’re paying for that GPU the entire time.
Pay-as-you-go:
With the API, the provider handles model updates, infrastructure scaling, security patches, and monitoring. While your team focuses on building features.
With self-hosting, your team handles GPU monitoring, service restarts, out-of-memory errors, version updates, security patches, and on-call rotations when things break.
Start with the API then switch to self-hosting when you’ve hit your break-even point.
Early Prototyping
When you’re building a new feature, you don’t know if it’ll work and you need to test fast.
With the OpenAI API, you’re testing your idea in 10 minutes:
import openai

client = OpenAI()

response = client.chat.completions.create(
  model="gpt-4",
  messages=[{"role": "user", "content": prompt}],
  temperature=0
)Done. No infrastructure setup, no model downloads, no GPU provisioning. Just an API key is needed.
Need Cutting-Edge Performance
Open source models lag 6-12 months behind frontier models. When GPT-5 launched, the best open source models are still catching up to GPT-4’s capabilities from 2023. If you need the absolute best performance, stick with APIs.
What is vLLM?
Before vLLM, people used tools like Ollama for local LLM development. Ollama is great for tinkering on your laptop. Easy setup, good for learning. But Ollama has limitations for production: memory inefficient, static batching, throughput plateaus under load.
vLLM rethought the architecture from scratch. It’s a high-performance inference engine built by researchers at UC Berkeley. Used in production by Databricks, Anthropic, and others.
The Core Problem vLLM Solves
Most LLM servers waste 60-80% of available GPU memory through pre-allocation.
Traditional servers look at the maximum possible memory a request could need (let’s say 8GB) and reserve the entire 8GB upfront, even though most requests only use 2-3GB. The other 5-6GB sits there unused and locked. With a 24GB GPU, you can only handle 3 concurrent requests because you’ve pre-allocated everything.
vLLM allocates memory dynamically in small blocks (similar to virtual memory in operating systems). It gives each request exactly what it needs, when it needs it. That same 24GB GPU now handles 12 concurrent requests instead of 3.
You can now serve 2-4x more requests on the same hardware.
vLLM’s Key Innovation
PagedAttention
Inspired by virtual memory in operating systems. Instead of allocating huge chunks of memory upfront, it breaks attention computation into small pages and blocks. This lets vLLM allocate memory dynamically as requests actually need it.
Continuous Batching
Traditional batching waits for a batch to fill up (say, 10 requests), processes them all together, then waits for the slowest request to finish before starting the next batch. Think of it like standard college admissions, where the next cycle doesn’t start until every request from the current cycle has been processed.
Continuous batching processes multiple requests together, but as soon as one request finishes generating its response, vLLM immediately adds a new request to fill that spot (think of it like rolling admissions). The batch size stays constant, but requests flow in and out continuously.
The result is higher throughput and lower latency because you’re not wasting GPU cycles waiting for every request to finish.
Optimized CUDA Kernels
When you run PyTorch on a GPU, it uses generic operations that work for any neural network. These operations are flexible, but flexibility comes at a cost. Remember that saying: jack of all trades, master of none.
vLLM’s team wrote custom GPU code (CUDA kernels) specifically optimized for running LLM inference. Instead of using PyTorch’s general-purpose matrix multiplications, they wrote code that does exactly what LLMs need and nothing more.
As a result, those custom kernels run 2-3x faster than PyTorch’s generic operations.
What does this mean for you? Let’s say you’re running a 7B model on a g5.xlarge instance. With generic PyTorch operations, you might process 20 tokens per second. With vLLM’s optimized kernels, you’re processing 40-60 tokens per second on the same hardware.
What’s nice is that you don’t need to understand CUDA or GPU programming to benefit from this. vLLM handles all the optimization automatically. You just call the API and get faster inference.
Getting Started with vLLM
Let’s get vLLM running locally first. Then we’ll connect it to the BAML code from Part 2.
Installation
System Requirements
- Linux (Ubuntu recommended)
- Python 3.8+
- NVIDIA GPU with CUDA support (or CPU for testing, but it’ll be slow)
- At least 16GB RAM
# Install vLLM
pip install vllm

# Verify installation
python -c "import vllm; print(vllm.__version__)"
Running Your First Model
Start with something small for testing. I’ll use Mistral-7B-Instruct, which is a popular open source model that works well for most tasks.
You can find models on the HuggingFace model hub at huggingface.co/models. HuggingFace has become the de facto repository for open source LLMs. HuggingFace is kind of like GitHub but for AI models.
When you see a model name like mistralai/Mistral-7B-Instruct-v0.3, here’s what the naming convention means:
- mistralai is the organization that created the model
- Mistral-7B-Instruct is the name of the model (7B refers to the number of parameters)
- v0.3 is the version number (newer versions usually fix bugs or improve performance)
One thing to keep in mind: a 7B parameter model takes about 14GB of disk space. Make sure you have enough storage before downloading. The first time you run vLLM with a model, it’ll download automatically, which can take 5-10 minutes depending on your internet connection.
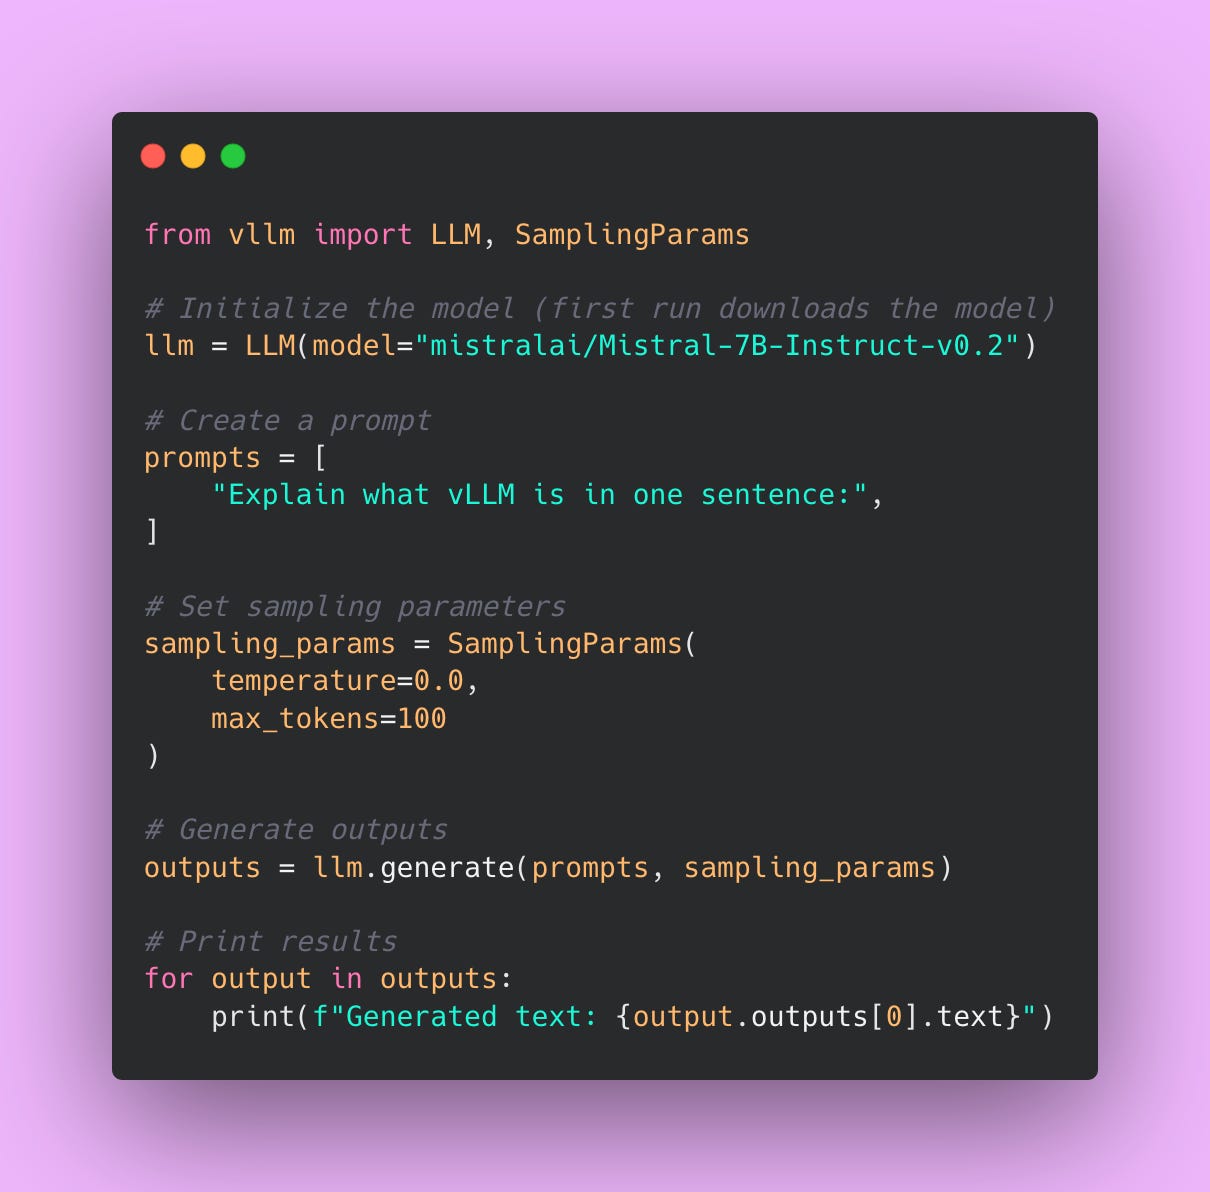
Understanding the Code
LLM()loads the model into GPU memorySamplingParams()controls generation (temperature, max length, etc.).generate()runs inference
Running as an API Server
vLLM can run as an OpenAI-compatible API server. This is a game changer.
If you’re currently using OpenAI’s API, your code probably looks something like this:
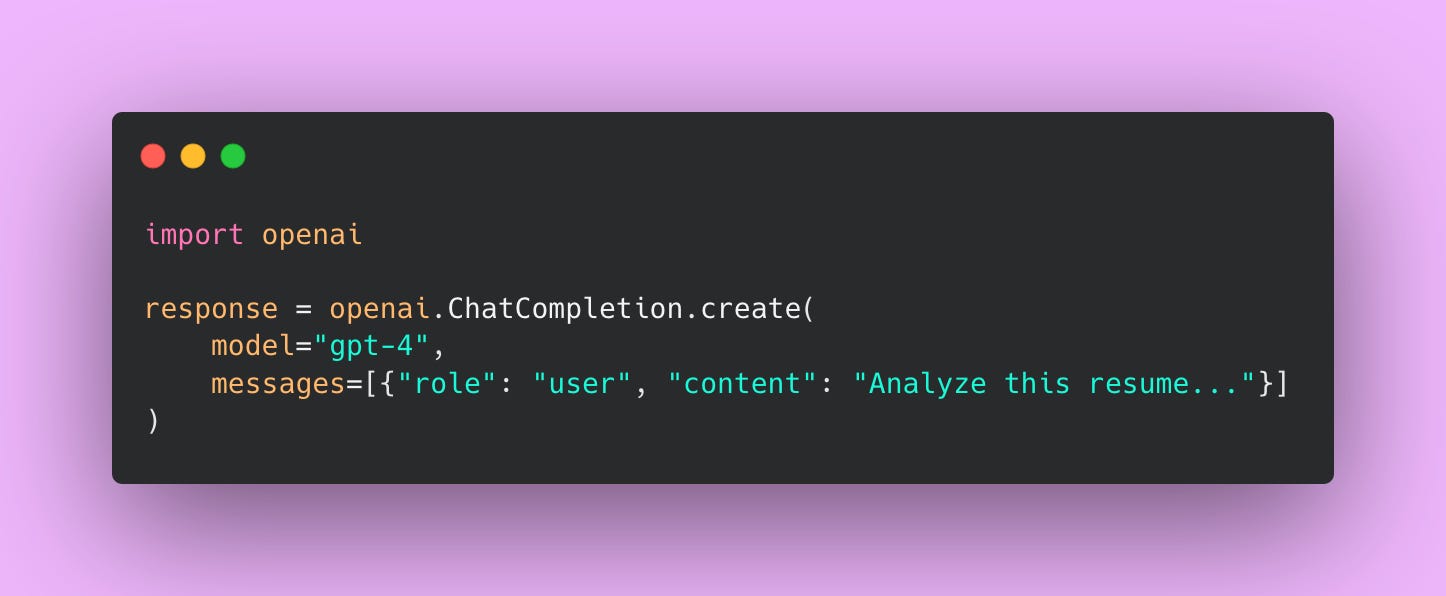
With vLLM running as an API server, you change one line:
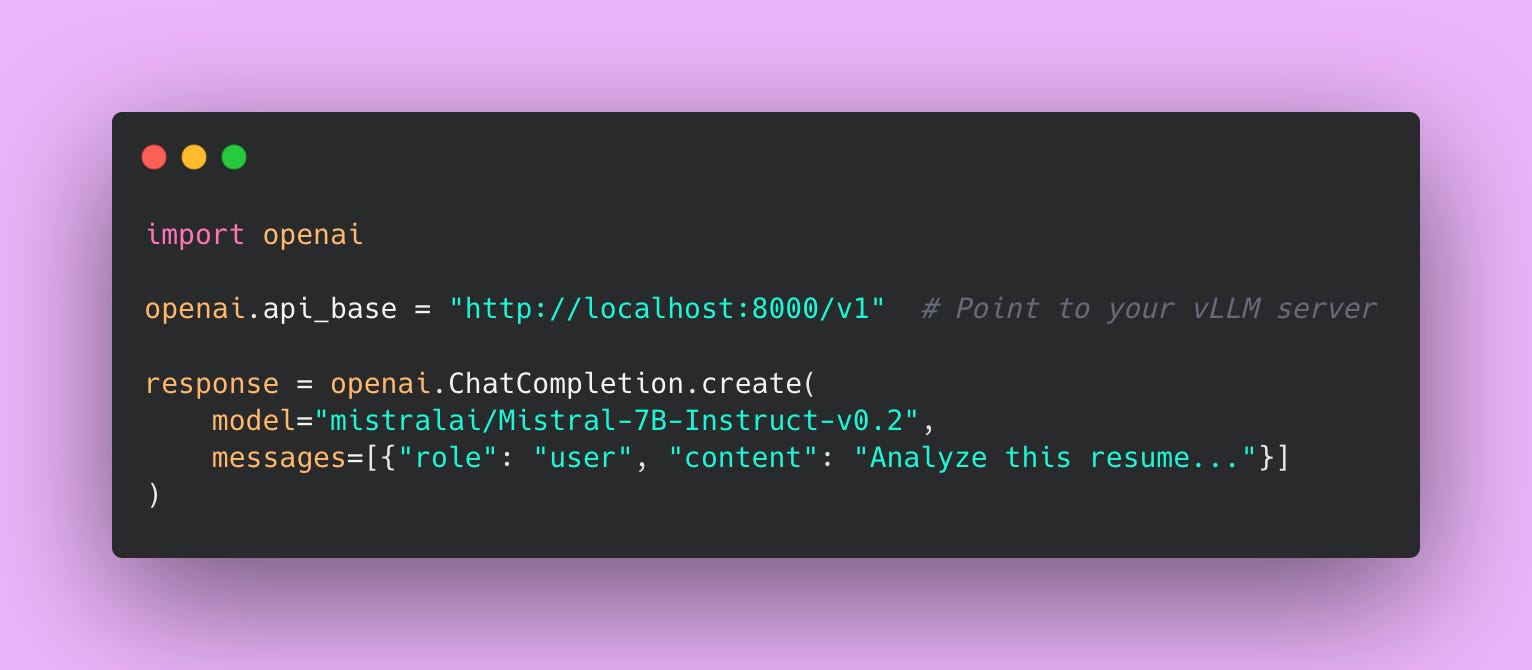
That’s it. Your application code stays the same. You’re not rewriting your entire codebase. You’re not learning a new API. You just point your existing OpenAI client to a different URL.
This means you can:
- Test vLLM locally before committing to infrastructure
- Switch between OpenAI and self-hosted models by changing one environment variable
- Use the same codebase for both your local dev environment (vLLM) and production (OpenAI or vLLM)
- Gradually migrate from OpenAI to self-hosted without a big rewrite
The OpenAI SDK has become the de facto standard for LLM APIs. By being compatible with it, vLLM lets you experiment with self-hosting without throwing away all your existing code.
Connecting BAML to vLLM
This is where all that abstraction work from Part 2 pays off. Remember when we set up BAML to use different LLM providers without changing our application logic? This is exactly why we did that.
We’re going to swap out OpenAI for vLLM by changing exactly one thing: the client configuration. Your application code, your prompts, your type definitions – all of that stays exactly the same. Zero changes to your business logic!
Update Your BAML Client
Open your BAML configuration file (usually baml_src/clients.baml) and add a new client for vLLM.
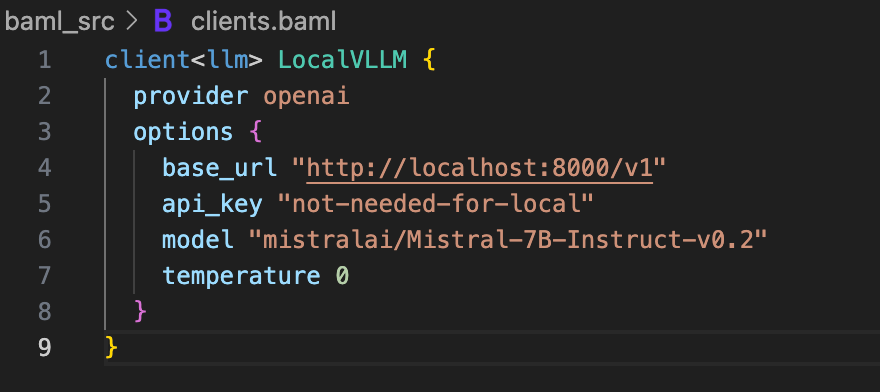
A few things to note here.
The provider is still openai because vLLM implements the OpenAI API spec. This is what makes the whole thing work – vLLM speaks the same language as OpenAI’s API.
The base_url points to your local vLLM server. If you’re running vLLM on a different machine or port, change this URL accordingly.
The api_key can be anything. vLLM doesn’t check API keys when running locally. I just put not-needed-for-local to make it explicit.
The model parameter needs to match exactly what you passed to vLLM when you started the server. If you started vLLM with –-model mistralai/Mistral-7B-Instruct-v0.3, use that exact string here.
Update Your Function to Use the New Client
Now find the function you want to switch over. In Part 2, we created a resume analyzer. Here’s how you change it.
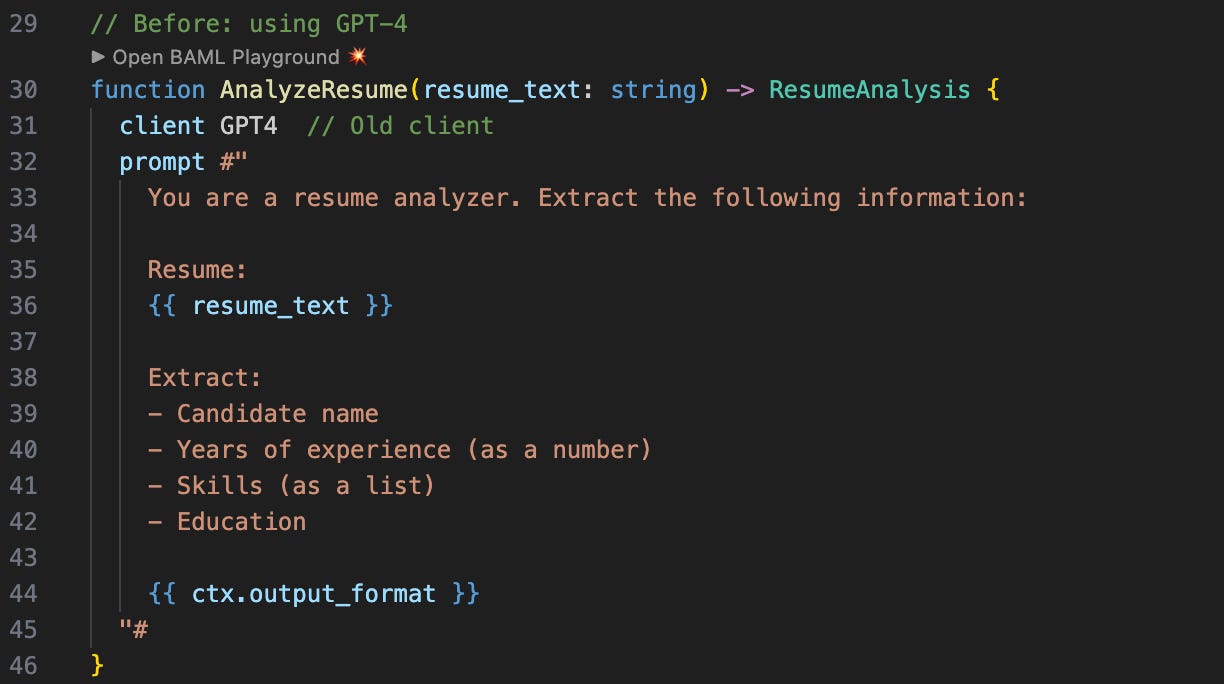
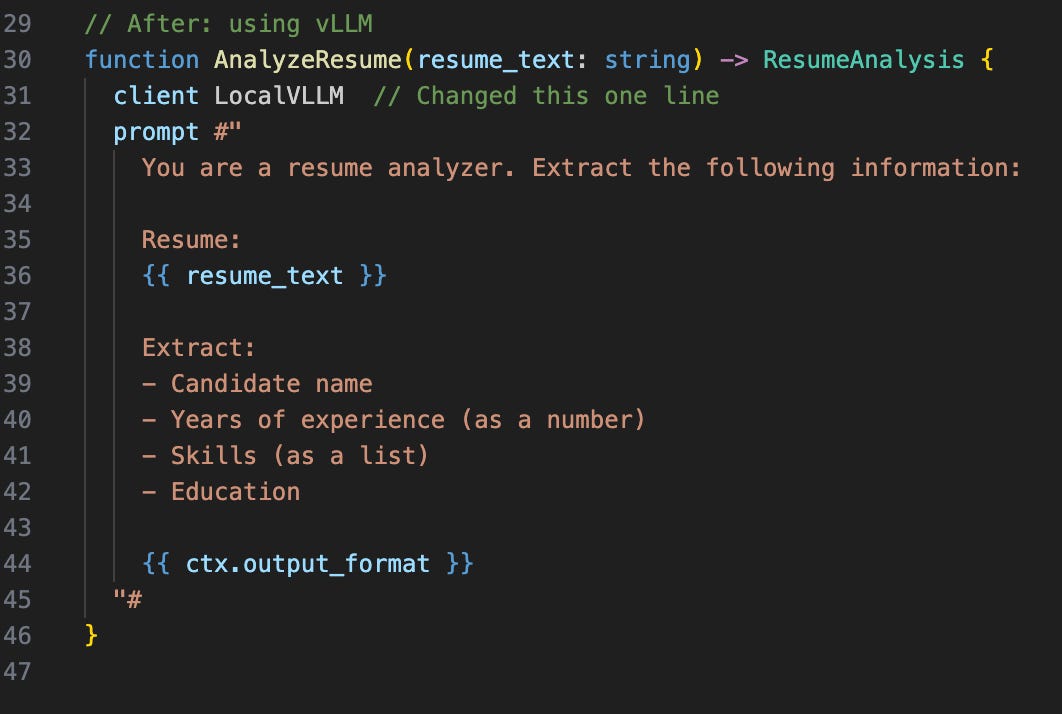
Everything else remains the same except for that one line.
Test It Works
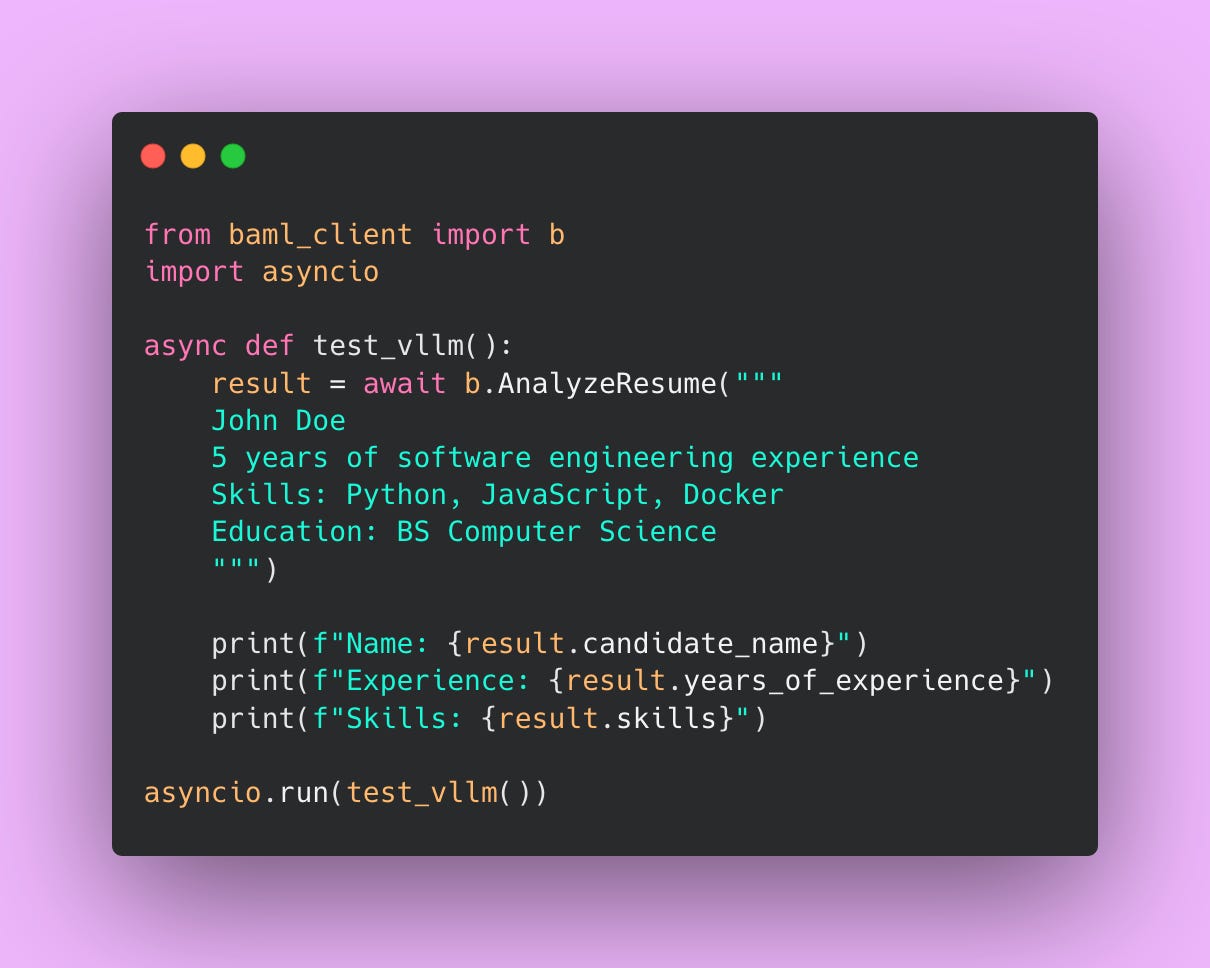
Now let’s verify that vLLM is actually being used and returning valid results by creating a test file.
Run the script:
python test_vllm.pyYou should see output like:
Name: John Doe
Experience: 5
Skills: [’Python’, ‘JavaScript’, ‘Docker’]
If you get an error like Connection refused or Failed to connect, check that your vLLM server is actually running on port 8000. Go back to the terminal where you started vLLM and make sure it says “Running on http://0.0.0.0:8000”
This is the Payoff
Let’s take a step back and appreciate what just happened. You switched from a $0.00275/request API (GPT-4) to a self-hosted model that costs $0.000088/request (assuming our $727/month infrastructure costs and 2M requests). That’s a 97% cost reduction.
And how much code did you change? One line.
This is why we built that abstraction in Part 2. Without BAML, you’d be rewriting your entire application – updating every API call, changing response parsing logic, handling different error formats, rewriting tests. Instead, you changed client GPT4 to client LocalVLLM.
You can now:
- Test locally with vLLM during development
- Switch to OpenAI for staging/testing if you want higher quality
- Use different models for different functions (cheap models for simple tasks, expensive models for complex ones)
- Implement fallback logic (try vLLM first, fall back to OpenAI if it fails)
All without touching your application code. Just configuration changes.
That’s the power of abstraction!
Production Setup
Running vLLM locally on your laptop is great for testing and development. But when you’re ready to deploy to production and serve real user traffic, you need a more robust setup. Production environments require three things that local testing doesn’t: reproducibility (it should work the same way on any machine), proper configuration (tuned for your specific workload), and monitoring (so you know when things break).
Let’s set up vLLM for production using Docker.
Docker Setup
I know some people groan when they hear “Docker,” but hear me out. Docker solves real problems that you’ll encounter in production.
Without Docker, you’re installing vLLM directly on your production server. That means you’re managing Python versions, CUDA drivers, system dependencies, and all the little quirks of that specific machine. If your server crashes and you need to spin up a replacement, you’re manually recreating that environment. If it works on your machine but fails in production, you’re spending hours debugging environment differences.
Docker packages everything your application needs into a container. The same container that works on your laptop will work on AWS, Google Cloud, your company’s on-prem servers, or anywhere else. You deploy once, and it runs everywhere identically.
Here’s what we’re going to build: a Docker container that includes Python, vLLM, and all dependencies. We’ll use Docker Compose to manage the container and configure GPU access. Then we’ll add environment variables so you can adjust settings without rebuilding the container.
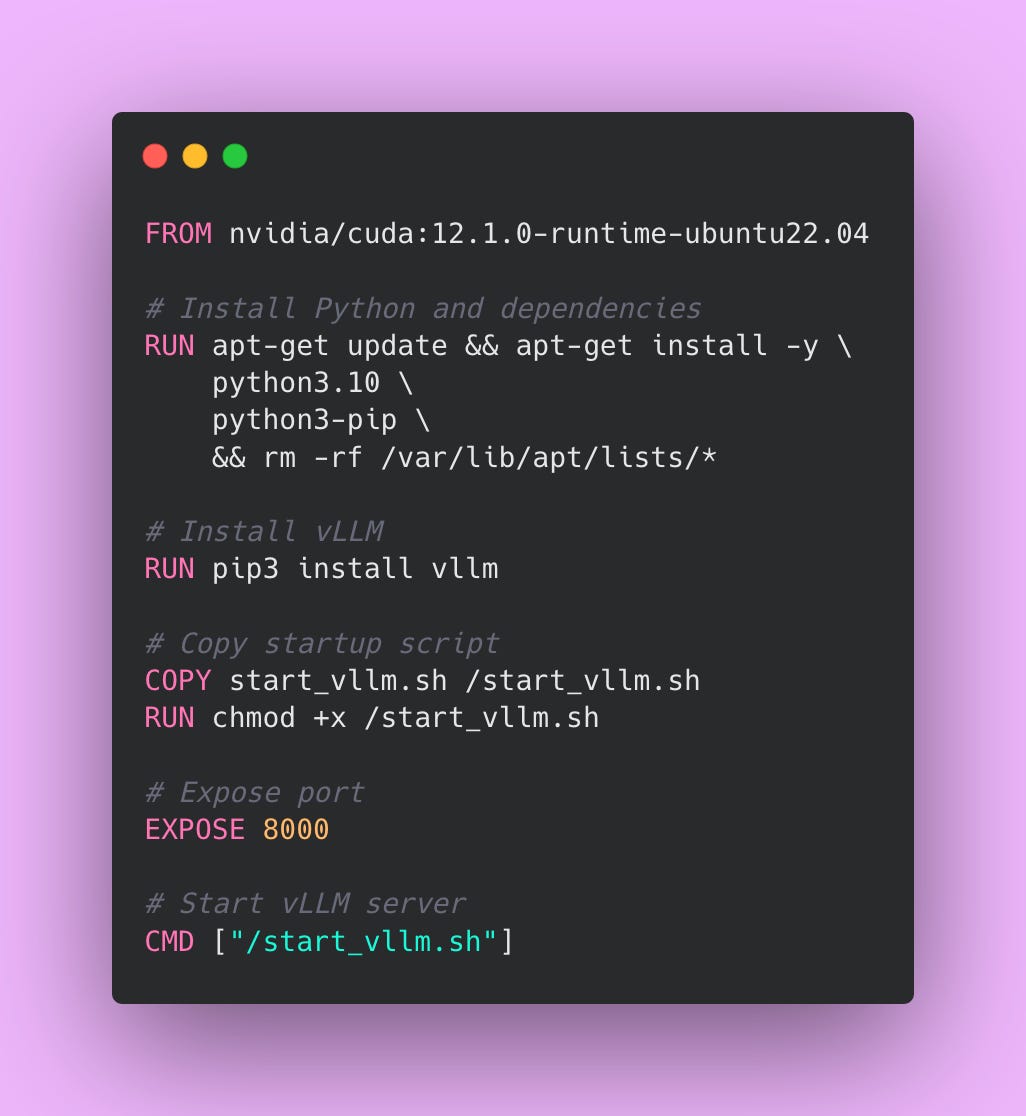
Create Your Dockerfile
Let me walk through what each section does.
We’re starting from nvidia/cuda:12.1.0-runtime-ubuntu22.04, which is NVIDIA’s official image that includes CUDA drivers. CUDA is what lets vLLM talk to your GPU. Without this base image, vLLM can’t access the GPU and will fall back to CPU inference (which is painfully slow for LLMs).
The first RUN command installs Python 3.10 and pip. We’re also running rm -rf /var/lib/apt/lists/* at the end to delete the package manager’s cache, which reduces the final image size by a few hundred megabytes.
The second RUN command installs vLLM via pip. This will take a while the first time you build the image (vLLM and its dependencies are several gigabytes), but Docker caches this layer so subsequent builds are faster.
We’re copying a startup script (which we’ll create next) into the container. The chmod +x command makes the script executable.
EXPOSE 8000 documents that this container listens on port 8000. This doesn’t actually open the port (Docker Compose handles that), but it’s good documentation for anyone reading your Dockerfile.
Finally, CMD tells Docker what command to run when the container starts. We’re running our startup script.
Create Your Startup Script
Create a file called start_vllm.sh in the same directory.
#!/bin/bash
python3 -m vllm.entrypoints.openai.api_server \
    --model ${MODEL_NAME:-mistralai/Mistral-7B-Instruct-v0.3} \
    --host 0.0.0.0 \
    --port 8000 \
    --gpu-memory-utilization ${GPU_MEMORY:-0.9} \
--max-model-len ${MAX_LENGTH:-4096}This script starts vLLM with configuration passed via environment variables. The ${MODEL_NAME:-mistralai/Mistral-7B-Instruct-v0.3} syntax means “use the MODEL_NAME environment variable if it exists, otherwise default to mistralai/Mistral-7B-Instruct-v0.3.” This lets you change the model without rebuilding the Docker image.
The --host 0.0.0.0 flag tells vLLM to listen on all network interfaces. Inside a Docker container, this is necessary for external connections to reach vLLM. If you used 127.0.0.1 (localhost), only processes inside the container could connect, which defeats the purpose.
Create Your Docker Compose File
Create a file called docker-compose.yml.
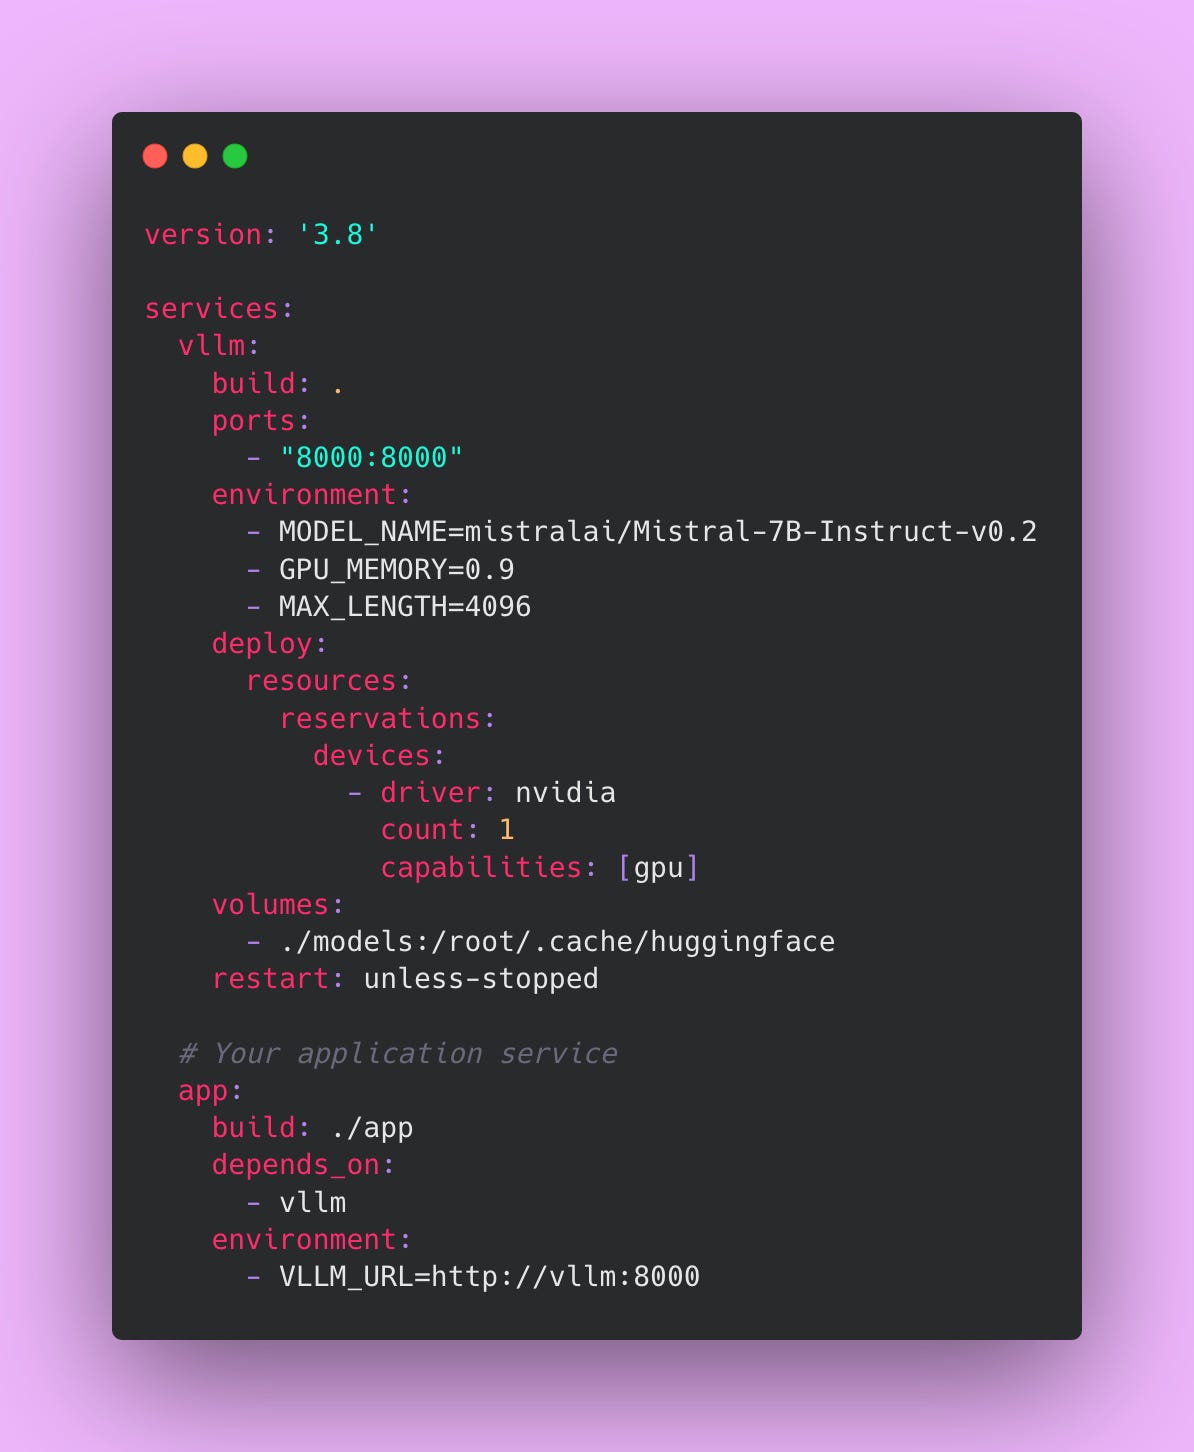
Docker Compose lets you define multiple services (containers) and how they interact. We’re defining two services: vllm (the inference server) and app (your application that calls vLLM).
The ports section maps port 8000 inside the container to port 8000 on your host machine. This lets you access vLLM at http://localhost:8000 from outside the container.
The deploy.resources.reservations.devices section gives the container access to your GPU. Without this, Docker won’t let the container see the GPU, and vLLM will fail to start.
The volumes section mounts a local directory (./models) into the container at /root/.cache/huggingface. This is where HuggingFace stores downloaded models. By mounting a local directory, the model persists between container restarts. Without this, you’d re-download 14GB every time you restart the container.
The restart: unless-stopped policy automatically restarts the container if it crashes. In production, you want this. If vLLM hits an out-of-memory error and crashes, the container will automatically restart and try again.
The app service is your application code. The depends_on: vllm line tells Docker Compose to start vLLM before starting your app. The VLLM_URL environment variable tells your app where to find vLLM. Since both services are in the same Docker Compose network, your app can access vLLM at http://vllm:8000 (using the service name as the hostname).
Build and Run Everything
docker-compose up -dThe -d flag runs containers in detached mode (in the background). Without it, Docker Compose would print logs to your terminal and you’d need to keep that terminal window open.
On the first run, Docker will:
- Download the base NVIDIA CUDA image (~4GB)
- Build your vLLM image (~6-12GB depending on dependencies)
- Start the containers
- Download the Mistral-7B model (~14GB)
This takes 10-30 minutes depending on your internet connection. Subsequent starts are much faster because everything is cached.
You can check if vLLM is running:
curl http://localhost:8000/healthIf you get a 200 response, vLLM is up and ready to serve requests.
Configuration Options
Now that vLLM is running in Docker, let’s talk about the configuration flags we’re using and what they actually do.
GPU Memory Utilization
The --gpu-memory-utilization flag controls how much of your GPU’s memory vLLM will use. It’s a float between 0.0 and 1.0, representing a percentage.
On a g5.xlarge with 24GB of GPU memory, setting this to 0.9 means vLLM will use up to 21.6GB (24GB × 0.9). The remaining 2.4GB is reserved for CUDA operations, PyTorch overhead, and a safety buffer to prevent out-of-memory errors.
You might think “why not use 100% of the GPU?” Because GPUs need some memory for internal operations. If you set this to 1.0, you’ll see random OOM crashes when vLLM tries to allocate just a bit more memory than available. Setting it to 0.9 gives you a buffer.
If you’re getting OOM errors even at 0.9, lower this to 0.85 or 0.8. You’ll handle fewer concurrent requests, but the server will be more stable.
If your GPU is barely utilized (you’re seeing 40-50% memory usage in nvidia-smi), you can try increasing this to 0.95. More memory means more concurrent requests, which means higher throughput.
Start with 0.9. Only adjust if you’re seeing problems.
Max Model Length
The --max-model-len flag sets the maximum number of tokens (input + output) that a single request can use.
Mistral-7B technically supports up to 8192 tokens (about 6000 words). But longer contexts use more memory. If you set --max-model-len 8192, each request reserves enough memory for 8192 tokens, even if most requests only use 500 tokens. You’re wasting memory.
Think about your actual use case. If you’re analyzing resumes (like our example), most resumes are 500-1000 words. That’s roughly 700-1400 tokens. Setting --max-model-len 2048 gives you plenty of headroom and doesn’t waste memory on unused capacity.
If you set this too low, requests with longer inputs will get truncated or rejected. If you set it too high, you’re using memory inefficiently and handling fewer concurrent requests.
Here’s a rule of thumb based on your use case:
- For resume analysis or short document processing, use 2048. Most business documents are under 1000 words.
- For customer support chat where context from previous messages matters, use 4096. You need room for conversation history.
- For long document summarization where you’re feeding in entire articles, use 8192. But be aware this significantly reduces your concurrent request capacity.
You can see the tradeoff: on a 24GB GPU with max-model-len=2048, you might handle 12 concurrent requests. With max-model-len=8192, you might only handle 4 concurrent requests. Choose based on your actual needs, not the maximum possible value.
Tensor Parallelism
The --tensor-parallel-size flag splits a model across multiple GPUs. This is only relevant if you’re running models that don’t fit on a single GPU.
For 7B and 13B models on a 24GB or 40GB GPU, you don’t need this. The model fits comfortably on one GPU.
For 70B models, you’d need something like --tensor-parallel-size 4 to split the model across 4 GPUs. Each GPU holds 1/4 of the model weights.
Unless you’re running very large models (70B+), ignore this flag entirely. Setting it when you don’t need it just adds complexity and slightly reduces performance due to inter-GPU communication overhead.
Configuration Examples for Different Use Cases
Let me show you hypothetical configurations for different scenarios.
Resume Analysis (our example)
- Model: Mistral-7B
- GPU: 24GB A10
- Max Model Length: 2048
- GPU Memory Utilization: 0.9
- Expected Throughput: 20-50 requests/sec
This configuration handles typical resumes lengths (1-2 pages) efficiently. You’re not wasting memory on unnecessarily long context windows.
Customer Support Chatbot
- Model: Llama-13B (better quality for complex queries)
- GPU: 40GB A100
- Max Model Length: 4096 (need room for conversation history)
- GPU Memory Utilization: 0.85 (being conservative with a larger model)
- Expected Throughput: 12-15 requests/sec
Customer support needs higher quality responses than resume parsing, so we’re using a 13B model. The longer context window accommodates conversation history (10-15 messages back and forth).
Document Summarization
- Model: Mistral-7B
- GPU: 24GB A10
- Max Model Length: 8192 (processing long articles)
- GPU Memory Utilization: 0.8 (lower because of long contexts)
- Expected Throughput: 10-15 requests/sec
Long contexts eat memory. We’re being conservative with GPU memory utilization and accepting lower throughput. If you need to summarize entire research papers or long-form articles, you need the full 8192 token context.
Notice the pattern? Smaller models, shorter contexts, and higher memory utilization give you better throughput. Larger models, longer contexts, and conservative memory settings give you better quality and stability. There’s always a tradeoff.
Configure based on what your application actually needs, not what’s theoretically possible.
Model Selection
Choosing the right model is probably the most important decision you’ll make when self-hosting. Get this wrong and you’re either wasting money on GPU power you don’t need, or delivering poor quality results that frustrate your users.
The good news is that for most applications, you don’t need the biggest, fanciest model. Let me walk you through your options and help you figure out what makes sense for your use case.
Starting with 7B Models
If this is your first time self-hosting an LLM, start with a 7B parameter model like Mistral-7B-Instruct or Gemma-7B. These models are the sweet spot for most applications.
A 7B model means the model has 7 billion parameters. Parameters are the weights and connections in the neural network that the model learned during training. More parameters generally means better quality, but also means more GPU memory, slower inference, and higher costs.
7B models fit comfortably on a 24GB GPU like the g5.xlarge we’ve been using. You’ll need at least 16GB of VRAM to run them, but 24GB gives you room for batching multiple requests and handling longer contexts. With a 7B model on a g5.xlarge, you’re looking at processing 50-100 tokens per second. That’s fast enough that users won’t notice any lag.
The quality is good for most tasks. Tasks like resume parsing, email classification, simple Q&A, content generation, basic code comments, and data extraction. If you’re building something like “analyze this customer support ticket and categorize it,” a 7B model will nail it.
About 60-70% of LLM applications work perfectly fine with 7B models.
When To Move Up to 13B Models
Sometimes you need better reasoning or more nuanced understanding. That’s when you consider a 13B model like Llama-2-13B.
The jump from 7B to 13B isn’t just about size. The quality difference is noticeable. A 13B model can handle more complex instructions, follow multi-step reasoning better, and produce more coherent long-form content.
This is what changes when you move to 13B.
You need more GPU memory. A 13B model technically works on a 24GB GPU but you’ll be pushing the limits. For production, you want a 40GB GPU like the A100. That gives you breathing room for batching and longer contexts without hitting out-of-memory errors.
Your speed drops to about 30-50 tokens per second. That’s still pretty fast for most applications, but you’re processing roughly half as many requests per second compared to a 7B model.
When should you use a 13B model? Complex customer support where you need to understand nuance and tone. Code generation beyond simple snippets. Content that requires maintaining context over multiple paragraphs. Analysis tasks where you need the model to make inferences beyond what’s explicitly stated.
The 70B Question
Llama-3-70B and similar models are the best open source models available. They’re approaching GPT-3.5 quality. However, they’re rarely worth it for self-hosting.
A 70B model requires multiple GPUs. You’re looking at 4 GPUs with 40GB each, using tensor parallelism to split the model across them. That’s roughly $10,000-$23,000 per month in cloud infrastructure costs if you’re using AWS p4d instances or Google Cloud A2 instances. On-premises is even worse upfront (4x A100 40GB GPUs cost $40,000-60,000 just for the hardware, plus servers, cooling, and power). You’re processing maybe 10-20 tokens per second.
At that point, just use GPT-4 via the API. You get better quality, faster inference, no infrastructure management, and probably lower costs unless you’re doing truly massive volume (we’re talking 50+ million requests per month to break even on those infrastructure costs).
I’ve only seen 70B models make sense for self-hosting in two scenarios. First, you have extremely strict data privacy requirements and absolutely cannot send data to OpenAI, even encrypted. Second, you’re processing tens of millions of requests per month and the cost savings of self-hosting actually pencil out even with multiple A100 GPUs.
For everyone else? If you need 70B-level quality, use the API. Self-hosting is about saving money at scale, not about having the biggest model.
A Critical Note About Instruction-Tuned Models
Always use instruction-tuned models for production. These are models with “-Instruct” or “-Chat” in the name, like “Mistral-7B-Instruct-v0.3” or “Llama-2-7B-Chat.”
Base models (like “Mistral-7B-v0.1” without the “Instruct” suffix) are not trained to follow instructions. They’re trained to predict the next token, which means they’ll continue your prompt rather than answer your question. If you prompt a base model with “Write a professional email to schedule a meeting,” it might just generate “Write a professional email to schedule a doctor’s appointment. Write a professional email to…” and keep going.
Instruction-tuned models are fine-tuned specifically to understand and follow instructions. They know when to stop. They format their responses appropriately. They understand conversational context.
Benchmarking Performance
Once you’ve got vLLM running, you need to know if it’s actually performing well.
I’ll show you how to benchmark your vLLM setup properly so you know what kind of performance to expect.
Create a Simple Benchmark Script
Here’s a Python script that sends 1000 concurrent requests to your vLLM server and measures throughput and latency.
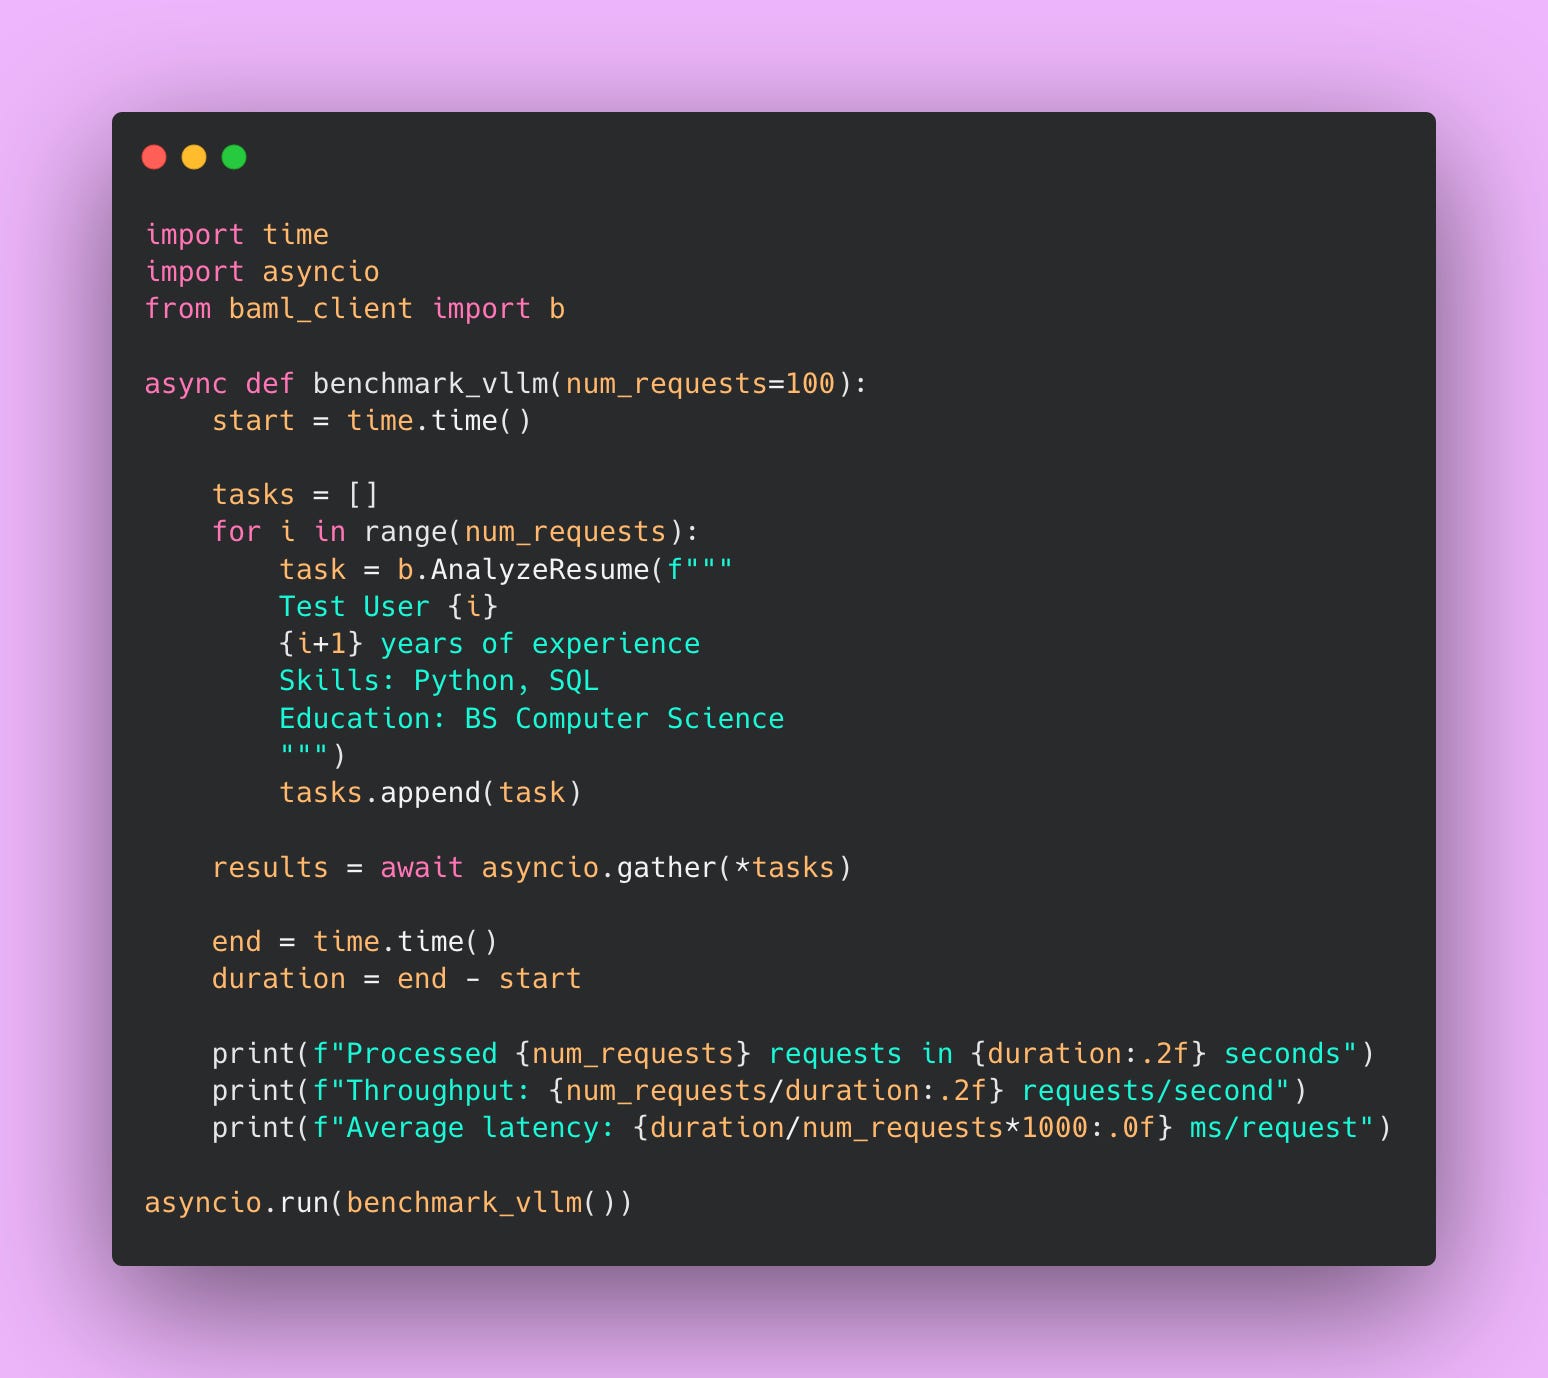
This script does something important: it tests concurrent requests, not sequential ones. In production, you’ll have multiple users hitting your API simultaneously. Sequential testing (sending one request, waiting for a response, sending another request) doesn’t reflect real-world usage.
The script creates 100 tasks and uses asyncio.gather() to send them all at once. This simulates 100 users hitting your endpoint simultaneously. That’s what actually stresses vLLM and shows you real performance characteristics.
Save this as benchmark.py and run it.
python benchmark.pyYou’ll see output like:
Processed 100 requests in 2.47 seconds
Throughput: 40.49 requests/second
Average latency: 24.7 ms/request
Troubleshooting Performance
Performance is Worse than Expected
If you’re seeing less than ideal numbers, something is up.
First, check your GPU utilization. Run nvidia-smi in another terminal while your benchmark is running. You should see GPU utilization at 80-95%. If it’s lower, you’re not batching effectively or your requests are too small to keep the GPU busy. If it’s at 100% constantly, you’re GPU-bound and might benefit from a larger GPU or smaller model.
Second, check your memory usage. Also visible in nvidia-smi. If you’re close to your memory limit, you might be hitting out-of-memory errors intermittently. Try reducing --max-model-len to free up memory. Each reduction in max length lets you handle more concurrent requests.
Third, if you have headroom on memory (you’re only using 60-70% of available VRAM), try increasing --gpu-memory-utilization from 0.9 to 0.95. More available memory means more concurrent requests in the batch.
Fourth, consider whether your GPU is actually the bottleneck or if it’s something else.
What if You Need Better Performance
You have a few options. The easiest is to scale horizontally. Run multiple vLLM instances behind a load balancer. Each instance handles its own batch of requests. This works well because LLM inference is embarrassingly parallel; one request doesn’t depend on another.
You can also try a smaller model. Mistral-7B-Instruct might perform almost as well as a 13B model for your specific use case. Run quality tests, but don’t assume you need the bigger model.
Or upgrade your GPU. A g5.2xlarge has the same GPU as a g5.xlarge (A10) but with more system RAM and CPU, which can help with pre/post-processing. For significantly better performance, consider the A100 (40GB or 80GB versions).
The important thing is to benchmark early and often. Don’t wait until production to discover your setup can’t handle the load. Run benchmarks during development. Run them after every configuration change. Know your numbers!
Monitoring and Maintenance
Running vLLM in production isn’t a “set it and forget it” situation. Production systems fail. GPUs run out of memory. Network connections drop. Models get stuck in weird states. You need to know when these things happen and why they’re happening.
Basic Health Checks
The simplest form of monitoring is a health check endpoint. vLLM exposes one at /health that returns a 200 status code if everything is working.
You can test it manually:
curl http://localhost:8000/healthIf you get back a 200 status code, vLLM is running and accepting requests. If you get a connection error or timeout, something is wrong.
Automated Health Checks in Python
Manual curl commands are fine for testing, but in production you want automated health checks that run continuously. Here’s a Python script that checks vLLM’s health and alerts you if something goes wrong.
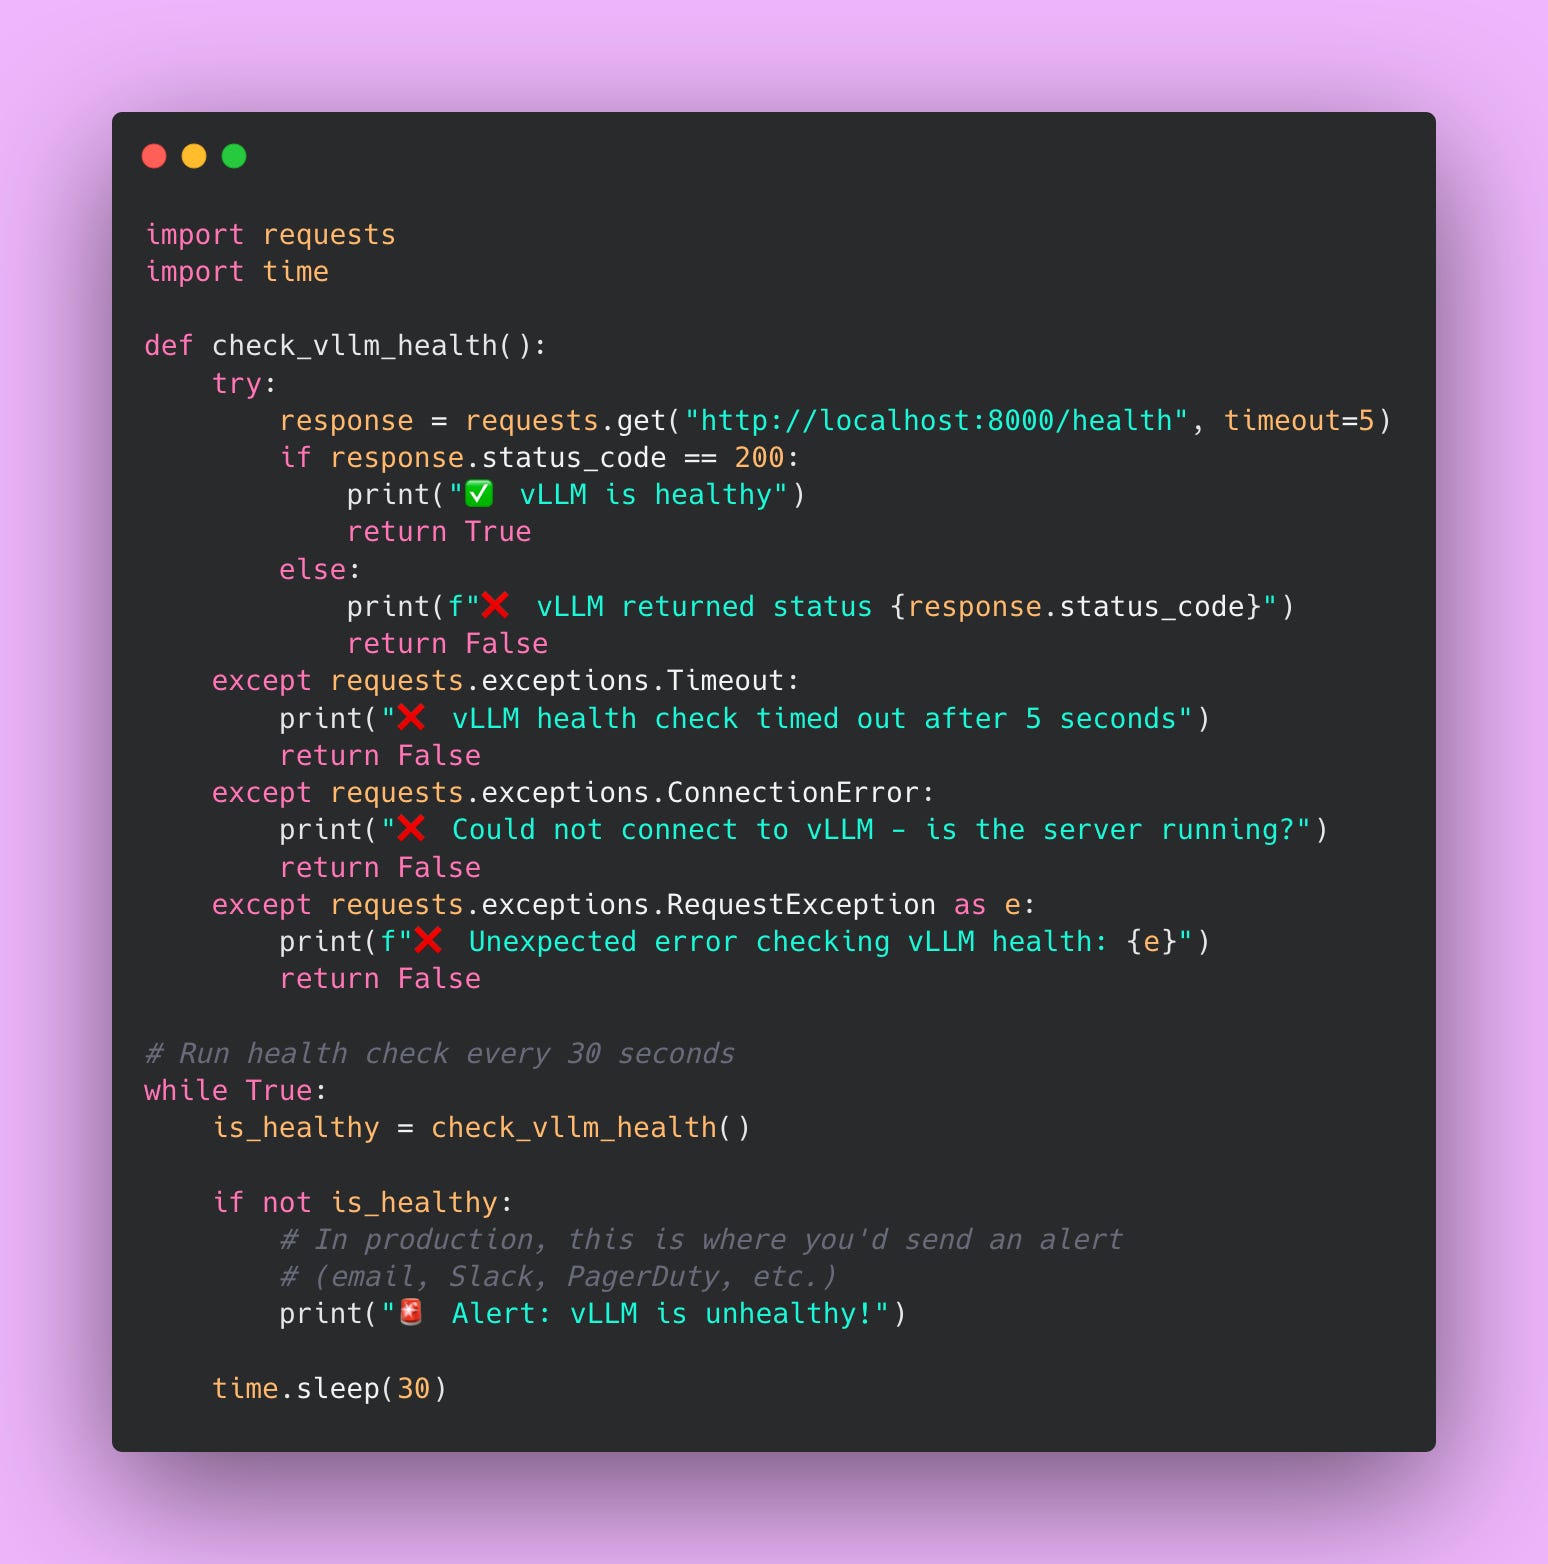
This script checks vLLM’s health every 30 seconds. If the health check fails, you’d want to send yourself an alert (via email, Slack, PagerDuty, or whatever alerting system your team uses). I’m just printing to the console here, but in production you’d integrate with your monitoring infrastructure.
The timeout=5 parameter is important. Without a timeout, the request could hang forever if vLLM is stuck. Five seconds is reasonable for a health check – if vLLM can’t respond in five seconds, something is seriously wrong.
Key Metrics to Watch
Health checks tell you if vLLM is running, but they don’t tell you if it’s running well. You need to monitor actual performance metrics to catch problems before they become outages.
GPU Utilization
This is the single most important metric to watch. GPU utilization tells you what percentage of your GPU’s compute capacity is being used.
You can check GPU utilization with nvidia-smi.
nvidia-smiThis displays a table showing GPU memory usage and utilization percentage. You’re looking for the line that says something like “GPU-Util: 87%”.
During active request processing, your GPU utilization should be 80-95%. If it’s consistently lower (say, 40-60%), you’re not batching requests effectively or your requests are too small to keep the GPU busy. You’re paying for GPU compute that you’re not using.
If your GPU utilization is at 100% constantly, you’re GPU-bound. Every request is waiting for GPU time. This isn’t necessarily bad if your latency is acceptable, but it means you can’t handle any more load without adding more GPUs.
Here’s what I typically see in production:
During normal business hours (moderate load), GPU utilization bounces between 70-90%. The GPU is busy but not maxed out. There’s headroom for traffic spikes.
During traffic spikes (like when a batch job runs and sends 1000 requests at once), GPU utilization hits 95-100% temporarily. That’s fine for short bursts.
During off-hours (minimal load), GPU utilization drops to 10-30%. The GPU is mostly idle, which is expected when there’s no traffic.
If your GPU utilization is consistently low even during peak hours, something is misconfigured. Check your batching settings and make sure requests are actually reaching vLLM.
Memory Usage
GPU memory usage tells you how much of your GPU’s VRAM is being used. This is different from utilization (which is compute capacity).
With nvidia-smi, you’ll see something like “15234MiB / 24576MiB” which means 15GB used out of 24GB available.
You want your memory usage to be high but not at the limit. If you set --gpu-memory-utilization 0.9 and you’re seeing 21-22GB used on a 24GB GPU, that’s perfect. You’re using the memory you allocated.
If you’re consistently hitting the memory limit (23.9GB used on a 24GB GPU with no headroom), you’re at risk of out-of-memory errors. Any request that needs slightly more memory than usual will crash vLLM. Lower your --max-model-len or --gpu-memory-utilization setting to create a buffer.
If you’re only using 12GB on a 24GB GPU, you’re being too conservative. You could handle more concurrent requests or longer contexts. Try increasing --gpu-memory-utilization from 0.9 to 0.95.
The worst scenario is seeing memory usage gradually climb over time. Let’s say it starts at 15GB, then after an hour it’s 18GB, then after two hours it’s 21GB, and eventually it hits 24GB and crashes. That’s a memory leak. Restart vLLM and check if there’s a known bug in your version. Memory leaks are rare in vLLM but not impossible.
Request Queue Depth
vLLM maintains an internal queue of requests waiting to be processed. When your GPU is busy processing a batch, new incoming requests sit in this queue.
vLLM logs the queue depth periodically. You’ll see log messages like:
INFO: Queue depth: 3
INFO: Queue depth: 7
INFO: Queue depth: 12
A small queue (1-5 requests) is normal and healthy. It means requests are arriving slightly faster than you can process them, but you’re keeping up.
A growing queue is a red flag. If you see the queue depth climbing from 5 to 10 to 20 to 50 over the course of a few minutes, you’re not keeping up with incoming traffic. Requests are piling up faster than you can process them.
What happens when the queue gets too large? Latency explodes. If there are 50 requests in the queue and you process 5 requests per second, the 50th request waits 10 seconds just to start processing. Users don’t wait 10 seconds – they timeout and retry, which adds even more requests to the queue. Death spiral 😵💫.
If you see your queue growing consistently, you need more capacity. Either scale horizontally (add more vLLM instances behind a load balancer) or vertically (move to a larger GPU that can process requests faster).
Latency Percentiles
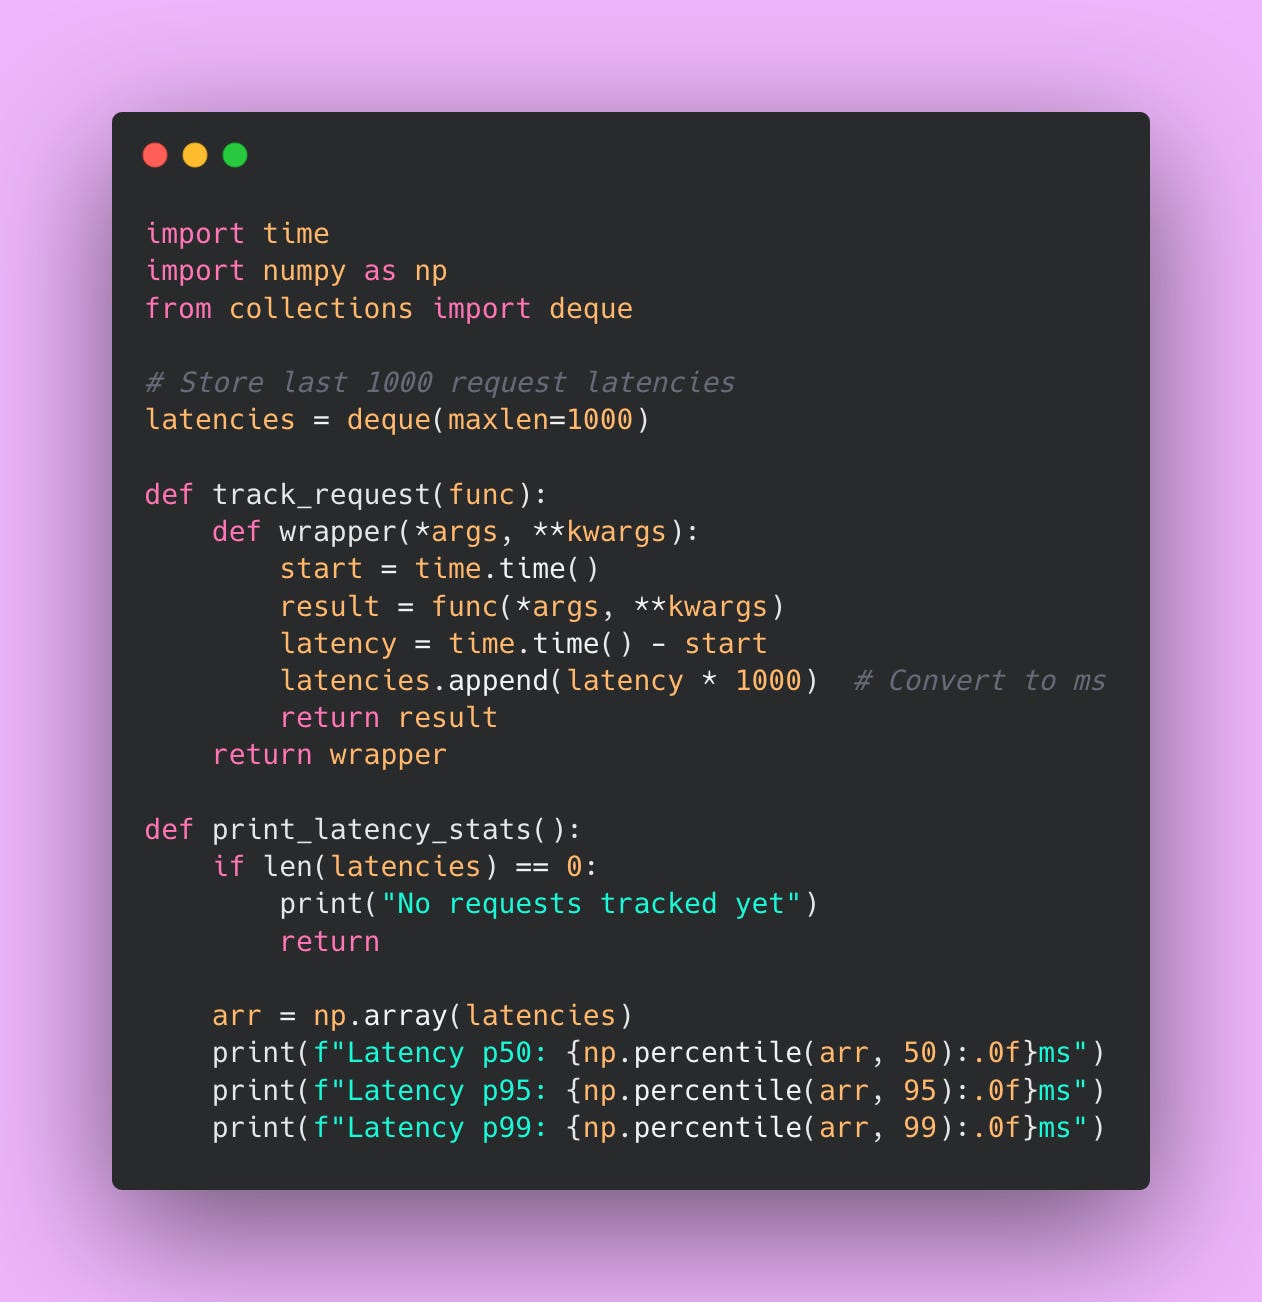
Average latency is useful, but it doesn’t tell the whole story. You need to track latency percentiles to understand the full distribution.
Here’s what each percentile means.
p50 (median) is the latency that half your requests experience. If p50 is 200ms, half your requests complete in under 200ms.
p95 means 95% of requests complete under this threshold. If p95 is 500ms, 5% of requests take longer than 500ms.
p99 means 99% of requests complete under this threshold. If p99 is 1000ms, 1% of requests take longer than 1 second.
Why track percentiles instead of just average? Because outliers matter. You could have an average latency of 300ms but a p99 latency of 5 seconds. That means 1 in 100 users is having a terrible experience, even though your average looks great.
If your p99 is over 2 seconds, users are definitely noticing. Some are probably timing out. You need to investigate why the slowest 1% of requests are so slow. Possible causes: occasional long inputs that hit your max-model-len limit, memory pressure causing occasional slowdowns, or queue backups during traffic spikes.
To track percentiles in Python, you can use a library like prometheus_client or just log request latencies and calculate percentiles periodically.
Common Failure Modes
Here are some production failures you could come across in production.
Out-of-memory Errors
This is the most common failure mode. You’ll see an error message like:
RuntimeError: CUDA out of memory. Tried to allocate 2.00 GiB
(GPU 0; 23.70 GiB total capacity; 21.80 GiB already allocated)
This means a request tried to allocate more memory than available. The GPU had 21.8GB already in use, tried to allocate another 2GB, but only had 1.9GB free.
There’s usually three reasons why this happens.
First, you set --max-model-len too high. You told vLLM that requests can use up to 8192 tokens, so it reserves enough memory to handle 8192-token requests in each batch slot. But your GPU doesn’t have enough memory for multiple 8192-token requests at once. Solution: lower --max-model-len based on your actual use case.
Second, you set --gpu-memory-utilization too high. You told vLLM to use 95% of GPU memory, which doesn’t leave enough buffer for CUDA operations and PyTorch overhead. Solution: lower it to 0.85 or 0.9.
Third, you got unlucky. Most requests are short, but occasionally someone sends a 5000-token input. That one request needs way more memory than usual and causes an OOM. Solution: set a maximum input length in your application layer before requests reach vLLM. Reject requests over your limit with a clear error message.
When vLLM hits an OOM error, it usually crashes completely. Your Docker container’s restart: unless-stopped policy will automatically restart it, but you’ve lost all in-flight requests. Users get errors. Not great.
The best solution is to prevent OOM errors in the first place by tuning your memory settings conservatively.
Slow Startup and Cold Starts
The first request to vLLM after startup takes 30-60 seconds to complete. This is because vLLM needs to load the model weights into GPU memory, initialize CUDA kernels, and warm up the inference pipeline.
Subsequent requests are fast, but that first request is painfully slow. If you’re running health checks, that first health check might fail because it times out before vLLM finishes initializing.
Solution: send a warmup request after vLLM starts up. In your startup script or Docker entrypoint, add a curl command that waits for vLLM to be ready.
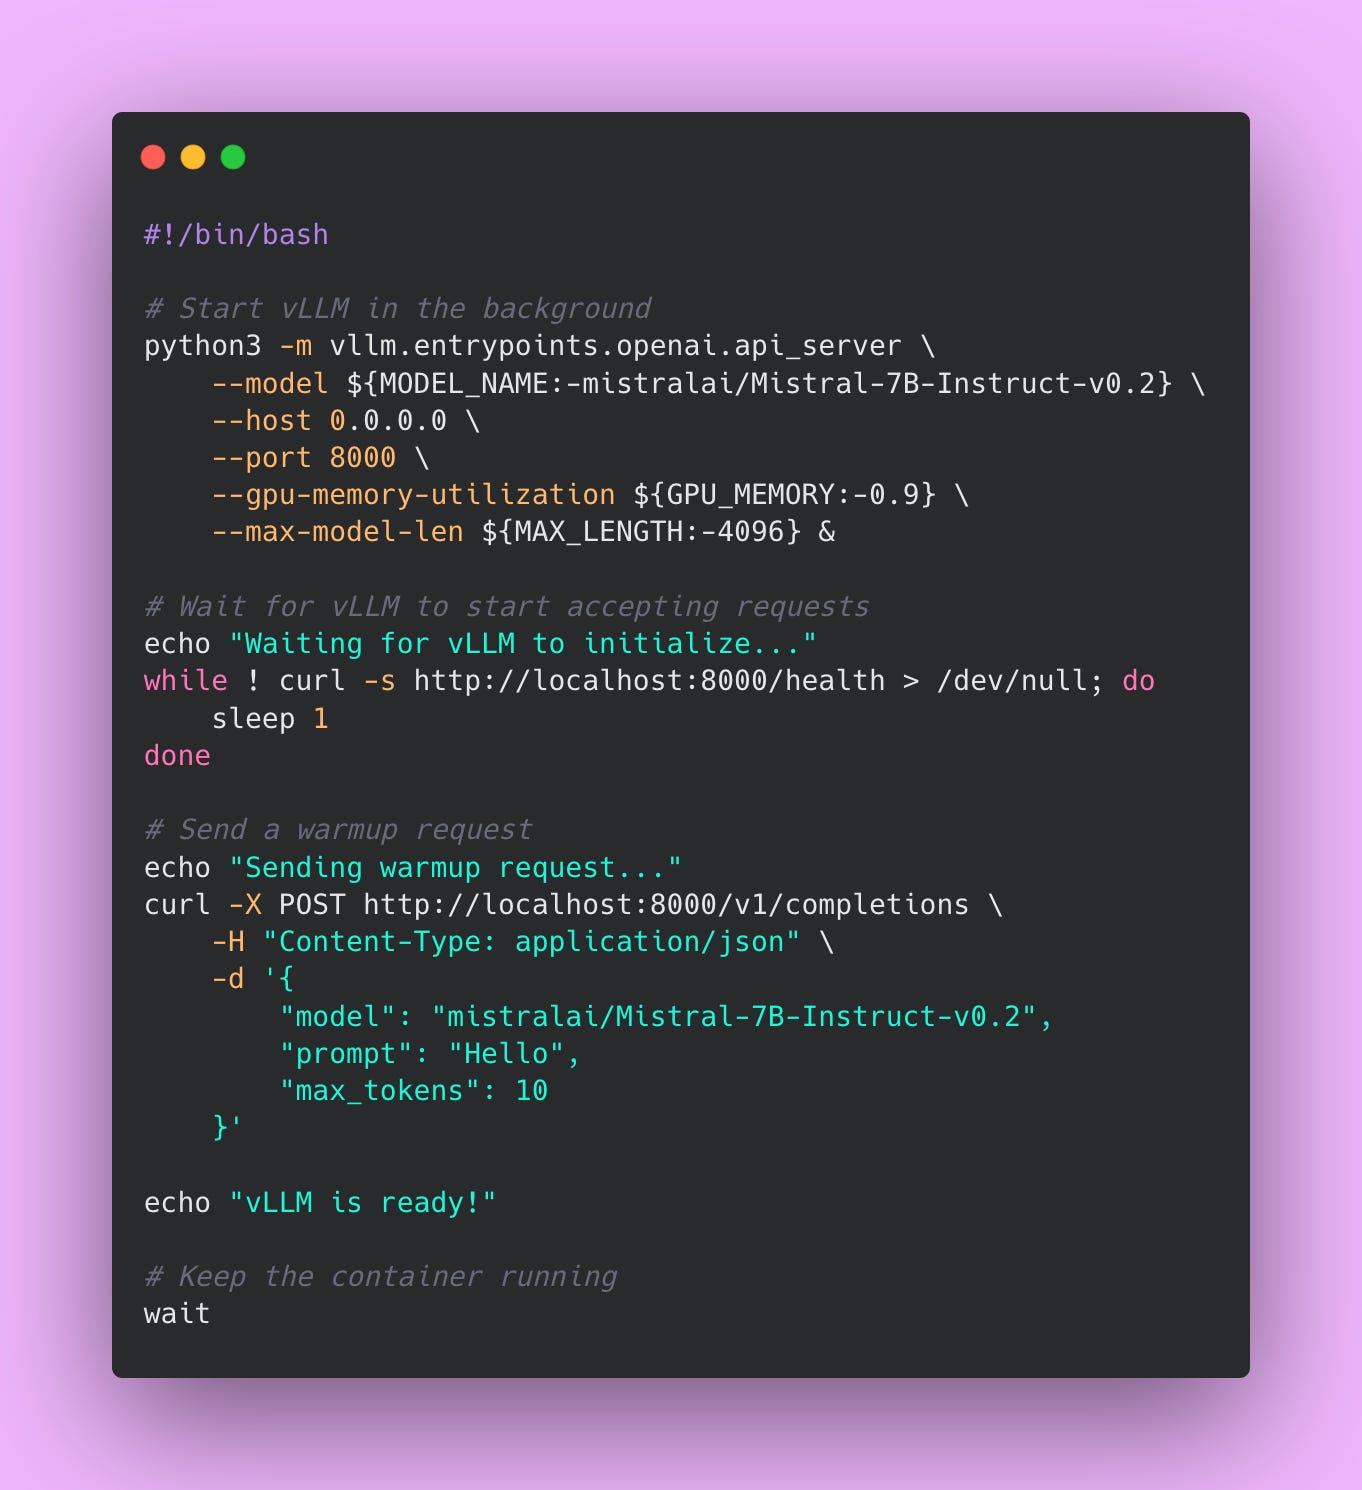
This script starts vLLM in the background, waits for the health endpoint to respond, sends a warmup request to load everything into memory, and then declares vLLM ready.
Performance Degrading Over Time
Sometimes vLLM starts out fast but gets slower over hours or days. Your p50 latency starts at 200ms, but after 12 hours it’s 400ms. After 24 hours it’s 600ms.
This usually indicates memory fragmentation or a memory leak. As vLLM processes millions of requests, the GPU memory gets fragmented (lots of small free chunks instead of large contiguous blocks). This makes it harder to allocate memory for new requests and slows things down.
Solution: restart vLLM periodically.
You can automate this with a cron job or your orchestration platform (Kubernetes can do rolling restarts automatically). Just make sure you’re doing rolling restarts (restart one instance at a time) so you don’t lose all capacity at once.
The GPU is There But vLLM Can’t See It
Sometimes Docker doesn’t properly pass GPU access to the container. vLLM starts up but immediately errors out with:
RuntimeError: No CUDA GPUs are availableThis happens when:
- You forgot the
deploy.resources.reservations.devicessection in docker-compose.yml - NVIDIA Docker runtime isn’t installed on the host
- The NVIDIA drivers on the host are outdated or broken
Check that NVIDIA Docker is working on your host:
docker run --rm --gpus all nvidia/cuda:12.1.0-base-ubuntu22.04 nvidia-smiIf this command fails, Docker can’t access your GPU. You need to install the NVIDIA Container Toolkit. If it works, the problem is with your docker-compose configuration.
These are some issues I’ve hit in production. Monitor for them proactively instead of discovering them when users are complaining. Set up alerts for OOM errors, high queue depth, and latency spikes. Check your GPU utilization daily. Restart instances during off-hours to prevent performance degradation.
Production isn’t glamorous, but it’s where your self-hosted LLM either proves its worth or becomes a maintenance nightmare. Put in the monitoring work upfront and you’ll sleep better at night.
Fallback Strategies
Never depend on 100% uptime of any single service. It doesn’t matter how reliable that service is. It will go down at the worst possible time.
Multi-Tier Fallback Architecture
The idea behind multi-tier fallback is simple: have multiple ways to get an answer, ordered by preference. Try the cheapest, fastest option first. If that fails, try the next option. Keep going until you get a result or run out of options.
Here’s an example.
Tier 1 is your self-hosted vLLM instance. This is your primary service. It’s fast, cheap, and handles 95% of requests under normal conditions. When everything is working correctly, all your traffic goes here. You’re paying $727/month for infrastructure and processing requests at $0.000088 each.
Tier 2 is OpenAI’s API. This is your fallback when vLLM is down, overloaded, or timing out. It’s more expensive ($0.00275 per request for GPT-4o), but it’s incredibly reliable. Under normal conditions, only 4-5% of your requests should hit this tier. That’s okay. You’re paying a small premium for reliability insurance.
Tier 3 is cached responses. For common queries that don’t change often, you can return cached results from previous requests. This is your emergency fallback. If both vLLM and OpenAI are unreachable (which is extremely rare), you can at least return something for common cases. Maybe 1% of requests use this tier.
Implementing Multi-Tier Fallback
Here’s an example on how to code this pattern.
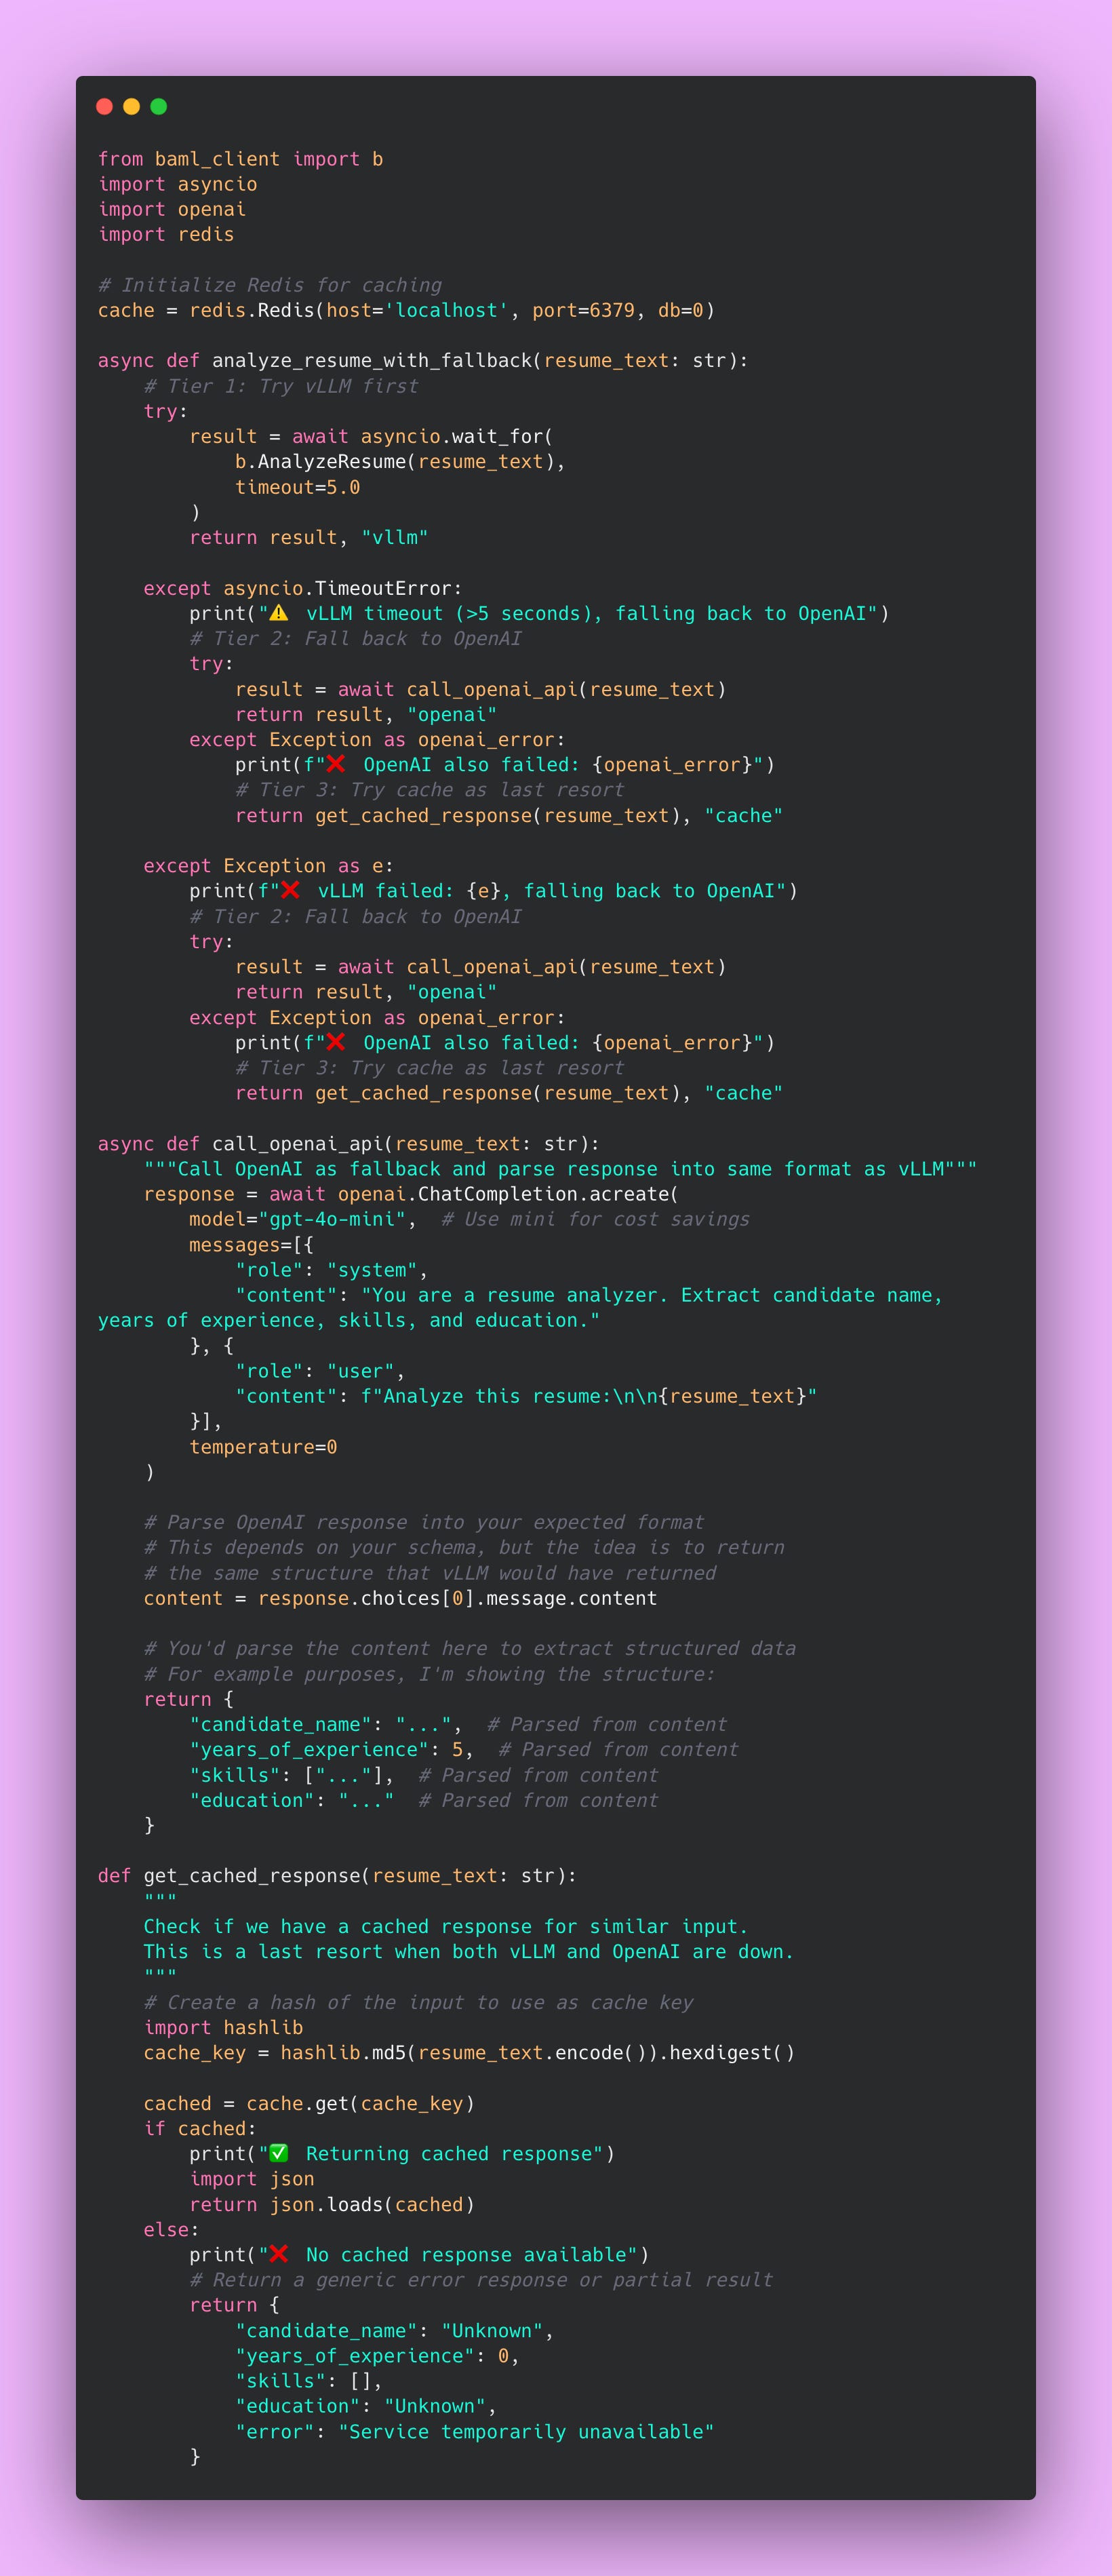
The function first tries vLLM with a 5-second timeout. If vLLM responds within 5 seconds, great. You return the result and you’re done. That’s the happy path that happens 95% of the time.
If vLLM takes longer than 5 seconds (timeout) or throws an exception (crash, out of memory, network error), you immediately fall back to OpenAI. You’re not making the user wait while vLLM struggles. Five seconds is already too long from a user experience perspective.
If OpenAI also fails (which is rare but possible during major outages), you check your cache for a similar request. Maybe someone analyzed this exact resume yesterday and you cached the result. Better to return a slightly stale result than nothing at all.
The cache is your emergency parachute. It won’t work for unique inputs, but for common queries (like “analyze this standard software engineer resume”), you might have a cached response. It’s better than showing users an error page.
The Circuit Breaker Pattern
Fallback tiers handle individual request failures, but what happens when vLLM is completely dead? You don’t want to keep trying it for every request, waiting 5 seconds for a timeout each time, then falling back to OpenAI. That’s 5 seconds of unnecessary delay per request.
This is where the circuit breaker pattern comes in. It’s like the circuit breaker in your house’s electrical panel. When there’s a problem (too much current), the breaker trips and stops trying to send electricity until you manually reset it. In software, a circuit breaker does the same thing: it stops trying a failing service and automatically recovers when the service is healthy again.
Here’s how it works:
When vLLM is healthy, the circuit breaker is “closed” (electricity flows). Requests go to vLLM normally.
When vLLM starts failing repeatedly (say, 5 failures in a row), the circuit breaker “opens” (electricity stops). Now all requests immediately skip vLLM and go straight to OpenAI. You’re not wasting time trying a service you know is down.
After a timeout period (say, 60 seconds), the circuit breaker goes into “half-open” state. It tries one request to vLLM to see if it’s recovered. If that request succeeds, the circuit closes and traffic resumes normally. If it fails, the circuit stays open for another 60 seconds.
This prevents cascading failures. Without a circuit breaker, you’d keep hammering vLLM with requests while it’s struggling, making the problem worse. With a circuit breaker, you give vLLM time to recover while your users get fast responses from OpenAI.
Implementing a Circuit Breaker
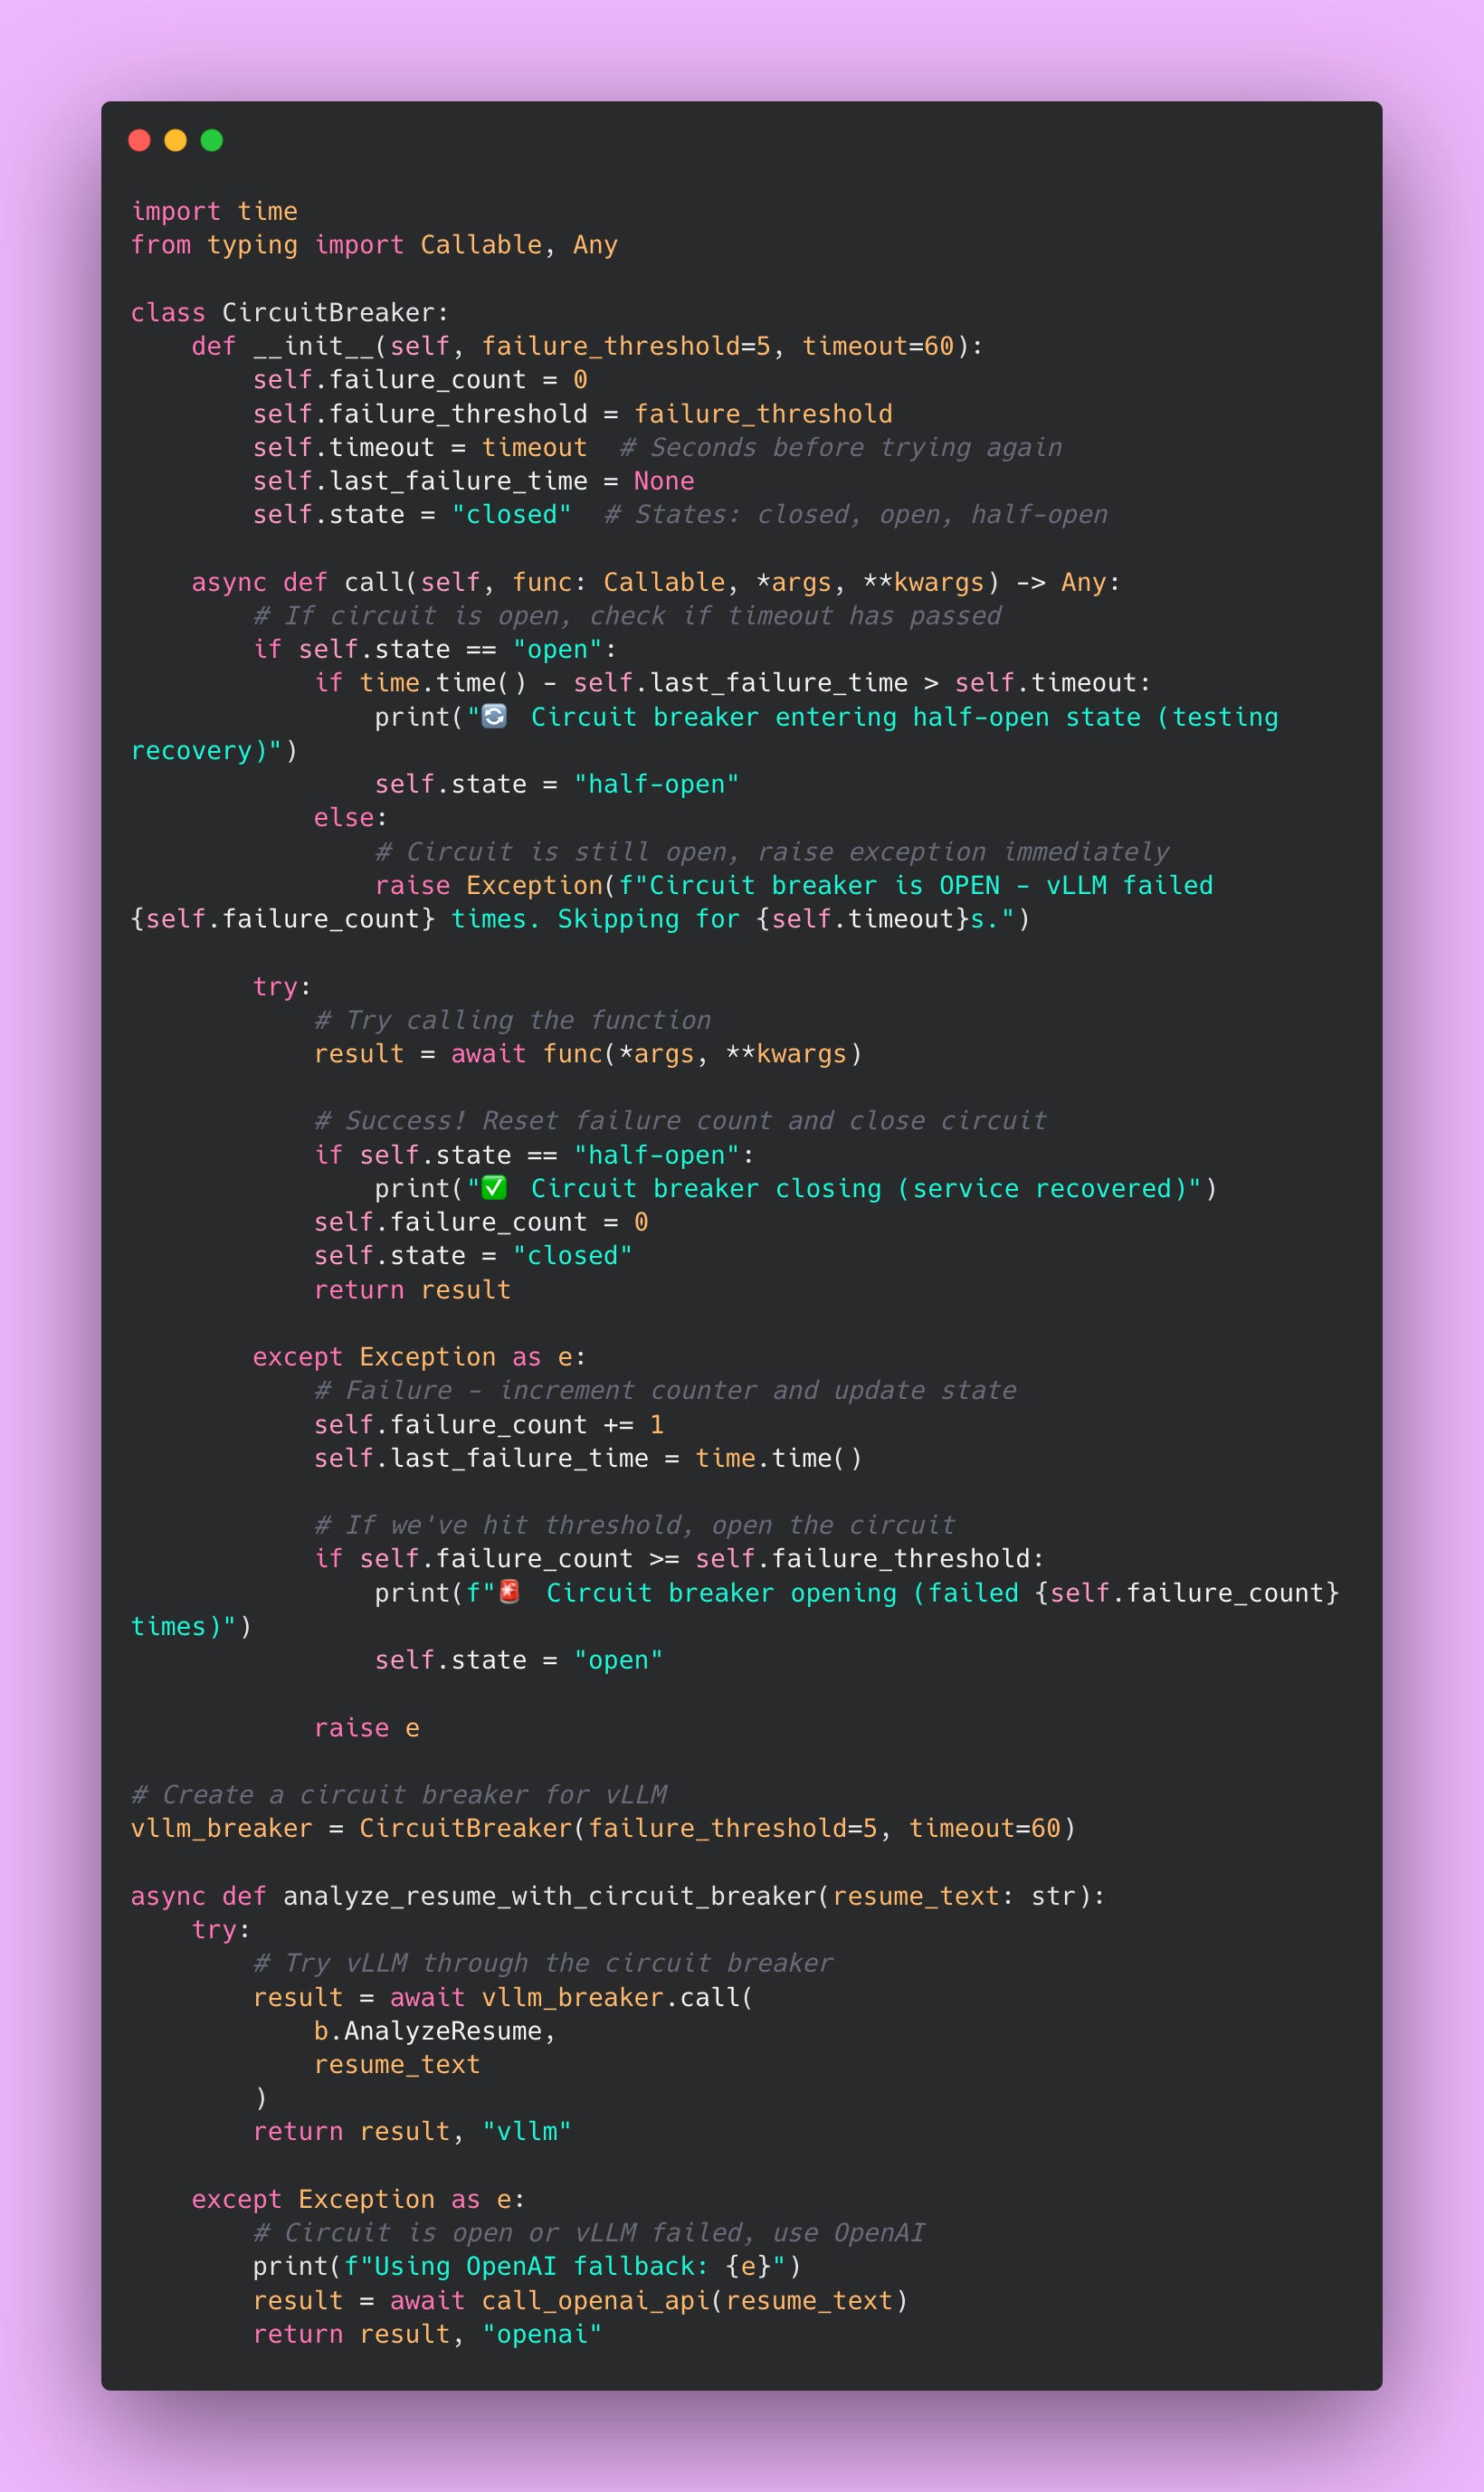
The circuit breaker prevents you from wasting resources on a service that’s clearly broken. If vLLM fails 5 times in a row, something is seriously wrong. Stop trying. Give it a minute to recover. Your users get fast responses from OpenAI instead of waiting 5 seconds per request for vLLM to timeout.
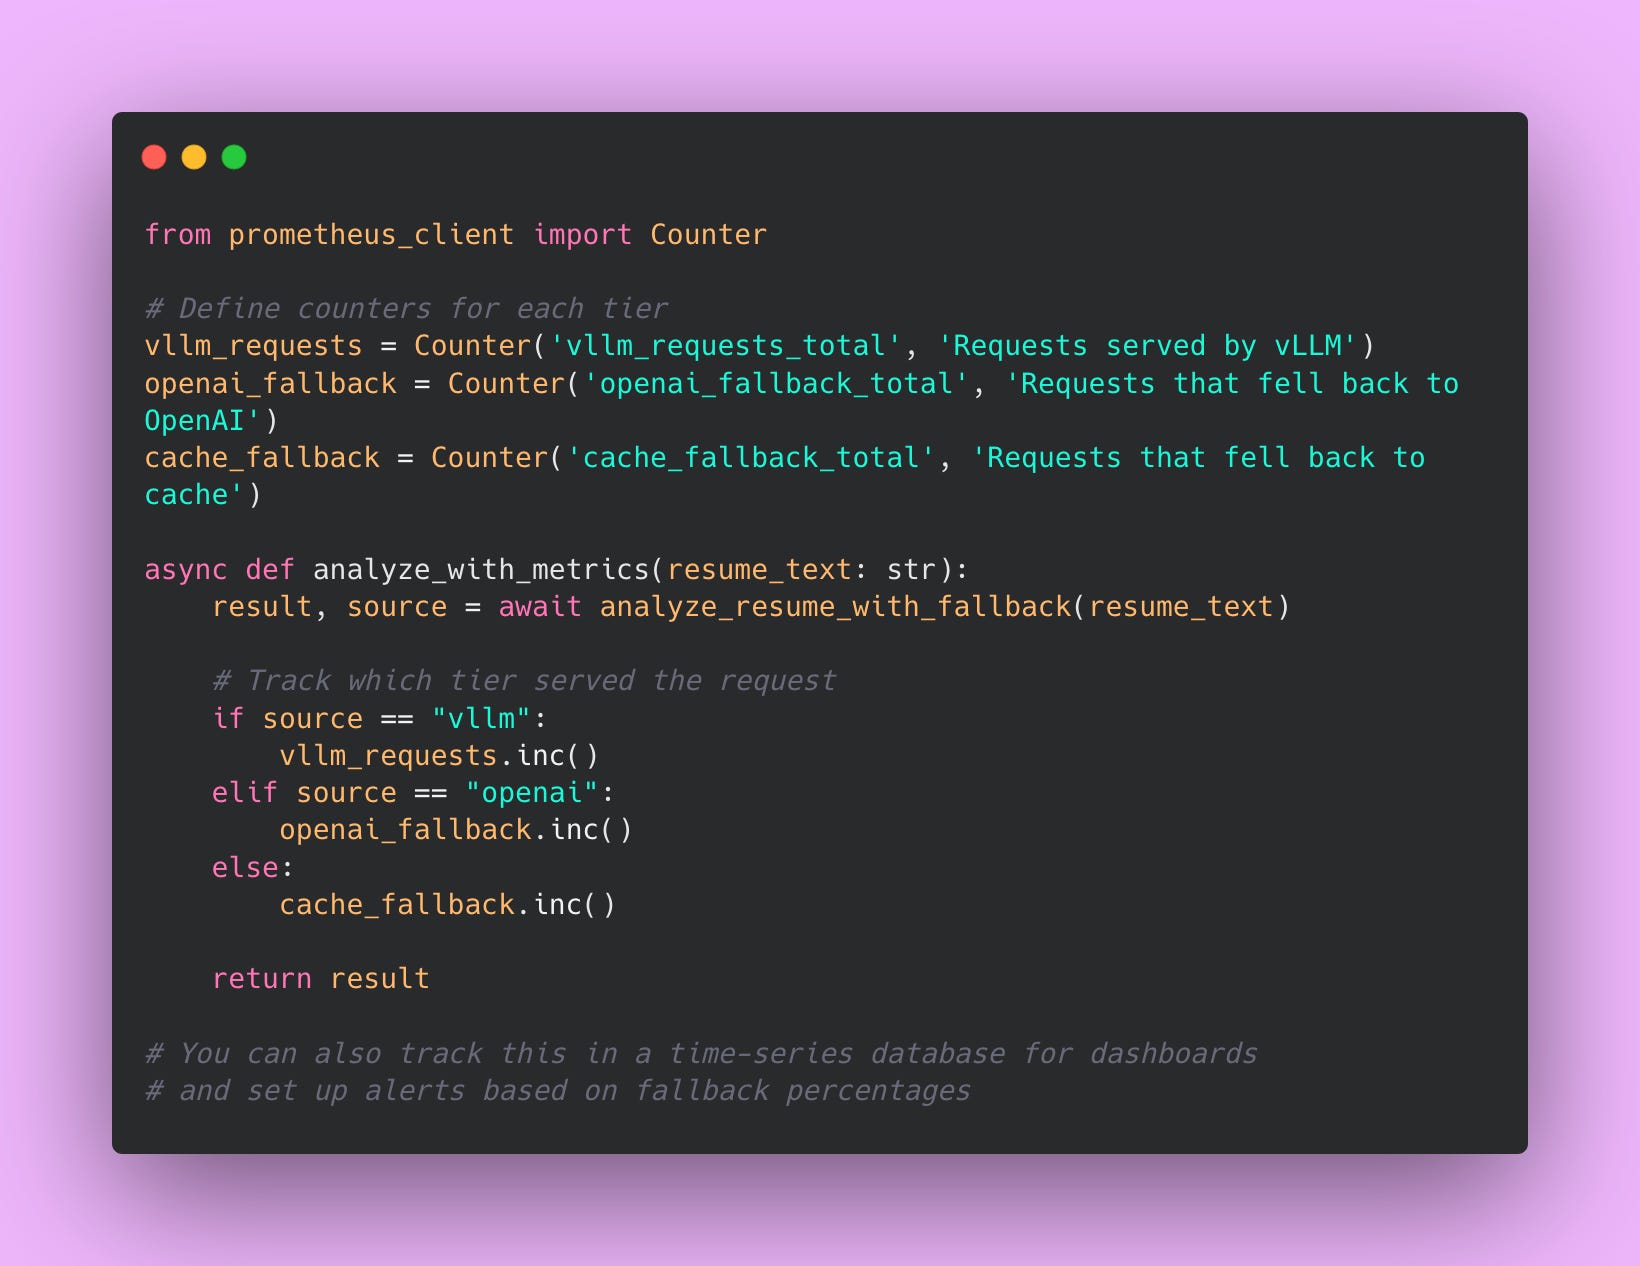
Monitoring Fallback Usage
Once you’ve implemented fallbacks, you need to monitor which tier is serving requests. If 50% of your traffic is hitting OpenAI instead of vLLM, something is wrong with your vLLM setup. You’re paying way more than you budgeted for.
Track fallback metrics using Prometheus (or whatever monitoring system you use).
Set Up Alerts for Abnormal Fallback Rates
If more than 10% of requests are using OpenAI fallback, something is wrong with vLLM. Maybe it’s hitting OOM errors, maybe your GPU is overloaded, maybe there’s a network issue. Investigate immediately before your costs spiral.
If any requests hit cache fallback, notify someone immediately. Cache fallback means both vLLM and OpenAI failed. That’s a critical outage. Users are getting degraded service (stale cached responses or errors).
I monitor these metrics in Grafana with alert rules.
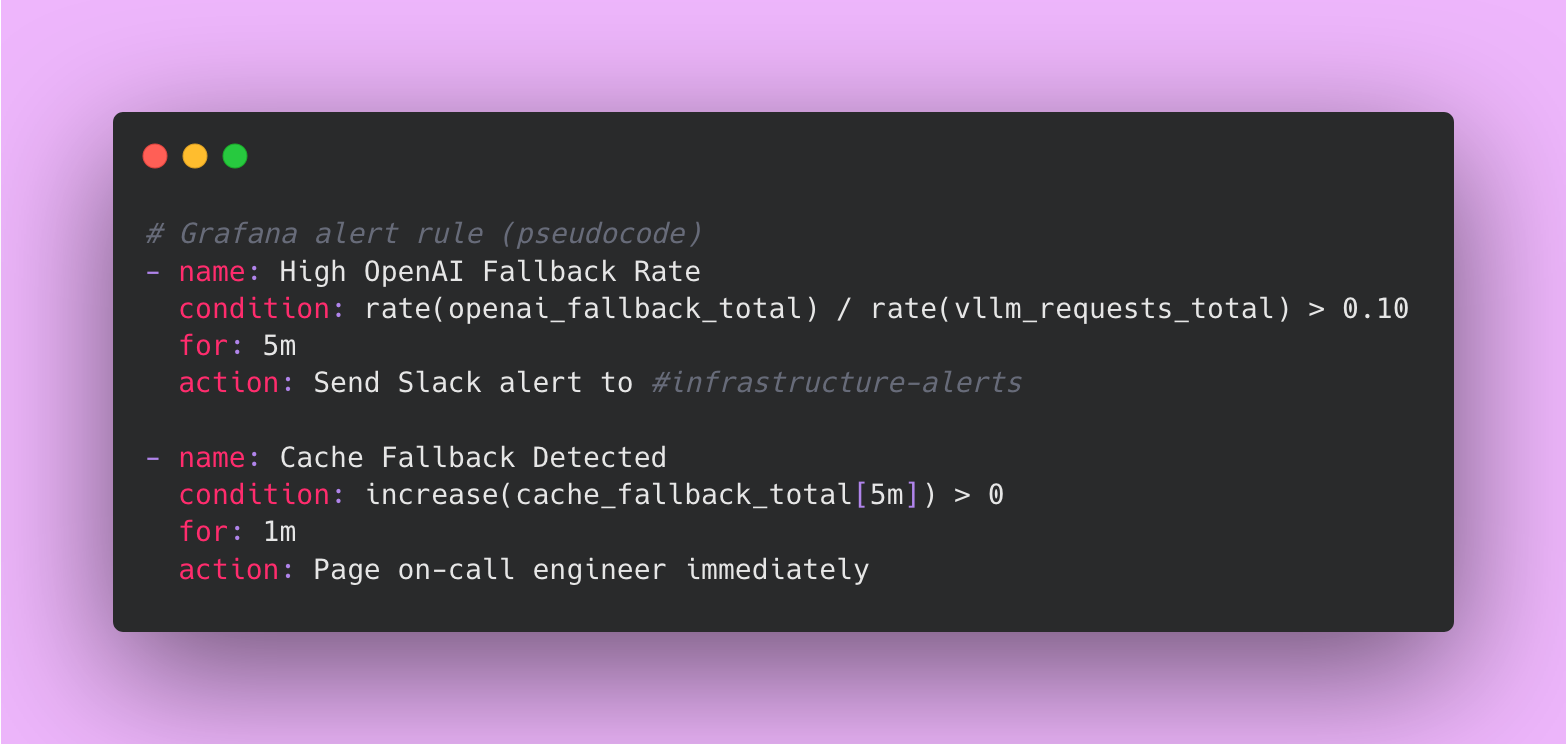
The first alert fires if more than 10% of requests hit OpenAI for more than 5 minutes. That’s abnormal and indicates a problem with vLLM.
The second alert fires immediately if any request hits cache in the last 5 minutes. That’s critical because it means both vLLM and OpenAI failed.
Understanding Your Fallback Costs
Let’s do some math to understand the cost impact of fallbacks.
Assume you’re processing 1 million requests per month. Under normal conditions:
- 950,000 requests go to vLLM at $0.000088 each = $83.60
- 50,000 requests fall back to OpenAI at $0.00275 each = $137.50
- Total: $221.10 per month
That’s still way cheaper than running everything through OpenAI (which would cost $2,750 for 1 million requests).
But what if vLLM is down 10% of the time?
- 900,000 requests go to vLLM at $0.000088 each = $79.20
- 100,000 requests fall back to OpenAI at $0.00275 each = $275
- Total: $354.20 per month
Your costs went up by 60%, but you’re still operational. Without fallbacks, you’d have 10% downtime and angry users. The extra $133 per month is cheap insurance.
This is why monitoring fallback rates matters. If your fallback rate is creeping up, you’re paying more than you expected. Fix vLLM before costs become a problem.
Final Thoughts on Resilience
Building resilient systems isn’t glamorous. It’s extra work upfront to handle edge cases that might never happen. But when they do happen, you’ll be glad you invested the time.
Your users don’t care if you’re saving 97% on infrastructure costs by self-hosting. They care that your application works when they need it. Multi-tier fallbacks, circuit breakers, and monitoring give you both: cost savings during normal operation and reliability during failures.
That’s the whole point of self-hosting with proper fallbacks. You get the economics of running your own infrastructure with the reliability of managed services.
Wrapping Up
We’ve covered a lot of ground in this four-part series. If you’ve made it this far, you now know more about self-hosting LLMs than most engineers working with AI today. Most teams jump straight to OpenAI’s API without ever questioning whether there’s a better way.
Let me recap what we’ve built and why it matters.
The Economics Make sense at Scale
In Part 1, we did the math. Self-hosting becomes economical above roughly 264,000 requests per month. Below that threshold, stick with the API. Above it, you’re potentially wasting thousands of dollars per month by not self-hosting.
However, the exact breakeven point doesn’t matter as much as understanding your usage patterns. If you’re processing 200,000 requests per month now but growing 20% month over month, you’ll hit the breakeven point in two months. Start planning your self-hosting infrastructure now, not when you’re already bleeding money on API costs.
vLLM is Genuinely Impressive Technology
The efficiency gains from vLLM aren’t marketing hype. PagedAttention, continuous batching, and optimized CUDA kernels combine to give you 2-4x better throughput compared to naive PyTorch implementations.
The technology works. Trust the benchmarks, but verify them with your own workload.
Production is Where Theory Meets Reality
Everything we covered in the Monitoring and Maintenance section about Docker, monitoring, and fallbacks might seem like overkill when you’re just testing vLLM locally. It’s not. Production is where all your assumptions get stress-tested by real users with real deadlines.
Build resilience from day one. Set up monitoring before you launch. Implement fallbacks before you need them.
BAML Abstractions Are the Secret Weapon
The ability to swap between self-hosted vLLM and OpenAI’s API with just a configuration change is not just convenient. It’s strategically important.
Without BAML, migrating from OpenAI to vLLM would mean rewriting your entire application. Changing every API call, updating response parsing logic, handling different error formats, rewriting tests. That’s weeks of engineering work and substantial risk.
With BAML, it’s a one-line change: client GPT4 becomes client LocalVLLM. Everything else stays the same. Your prompts don’t change. Your type definitions don’t change. Your application logic doesn’t change.
This gives you flexibility. You can test vLLM during development, use OpenAI for staging, and run different models for different functions in production. You can implement fallback logic where cheap requests go to vLLM and complex requests go to GPT-4. You can experiment without committing to a complete rewrite.
That abstraction work we did in Part 2 pays for itself many times over. It’s the difference between being locked into a vendor and having options.
Key Principles Worth Remembering
Throughout this series, a few themes kept coming up. These are worth internalizing:
Always do the cost analysis for your specific situation. The numbers I provided are examples, not gospel. Your infrastructure costs might be different. Your request volume might follow different patterns. Your quality requirements might justify different model choices. Plug in your actual numbers and make decisions based on your reality, not my examples.
Build fallback strategies before you need them. Every production system fails eventually. Your self-hosted infrastructure will go down. OpenAI’s API will have an outage. Your circuit breaker will trip. When these things happen, having fallbacks means your users never notice. Not having fallbacks means you’re scrambling to fix things while your application is broken.
Monitor everything you care about. You can’t fix what you can’t see. Track your GPU utilization, memory usage, request queue depth, and latency percentiles. Set up alerts before problems become outages. I’ve spent too many hours debugging issues that would have been obvious if I’d just looked at the right metrics earlier.
Start simple and graduate to complexity. Begin with OpenAI’s API. When you hit the economic threshold, move to self-hosting. Start with a 7B model before jumping to 70B. Run one vLLM instance before implementing multi-instance load balancing. Every layer of complexity you add creates new failure modes. Add complexity only when you have a specific problem to solve.
Where to Go From Here
If you’re just starting your LLM journey, stick with OpenAI’s API for now. Focus on building your application and understanding your users’ needs. Once you’re processing hundreds of thousands of requests per month, come back to this series and start planning your self-hosting migration.
If you’re already at scale and paying too much for API calls, start with a cost analysis. Figure out your breakeven point. Then work through Part 2 to set up BAML abstractions. Finally, use the Monitoring and Maintenance section as a deployment guide. Take it step by step.
If you’ve been running self-hosted LLMs but struggling with reliability, focus on monitoring and fallback strategies. Resilience engineering isn’t glamorous, but it’s what separates hobby projects from production systems.
My Final Thoughts
Writing this series taught me that self-hosting LLMs is no longer a bleeding-edge experiment for companies with unlimited engineering resources. The tooling has matured. vLLM is production-ready. The economics make sense at reasonable scale.
But it’s also not a silver bullet. Self-hosting introduces operational complexity. You’re trading API costs for infrastructure management, monitoring, and on-call responsibilities. That tradeoff makes sense for some teams and not for others.
The key is knowing when you’re on which side of that line. If you’re processing 50,000 requests per month, stay with the API. If you’re processing 5 million requests per month and haven’t considered self-hosting, you’re probably overpaying by tens of thousands of dollars.
Do the math. Build the abstractions. Plan for failure. Monitor everything. And don’t be afraid to experiment. The worst that happens is you learn something new about your system.
Good luck with your self-hosting journey.
Happy savings 💰